Invercargill (New Zealand electorate)

Summary

Invercargill is an electorate of the New Zealand Parliament that has existed since 1866. Since the 2020 election, the electorate's representative is Penny Simmonds of the National Party.

Invercargill
Single-member constituency
for the New Zealand House of Representatives
Outline map
Location of Invercargillwithin Southland
RegionSouthland
Area10,941.44 km2 (4,224.51 sq mi)
Current constituency
Created1866
Current MPPenny Simmonds
PartyNational

Population centres edit

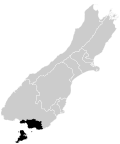
The electorate covers Invercargill city and the surrounding rural area, including Stewart Island / Rakiura. In 1996 a boundary redistribution resulted in the abolition of the Awarua electorate and merged with Invercargill following re-drawing of boundaries due to the introduction of mixed-member proportional voting (MMP). Minor but steady population decline in the Southland region has generally resulted in Invercargill expanding northwards. The 2013 redistribution, however, has left Invercargill unchanged.[1] The 2020 redistribution added a large area around Clifden and Tuatapere.[2]

History edit

The electorate was established in 1866 when it separated from the Wallace electorate.[3]

The first representative was William Wood, who won the 1866 election.[4] Wood retired at the end of the parliamentary term in 1870. William Henderson Calder succeeded Wood in the 1871 election and he resigned in March 1873.[5] The resulting 1873 by-election was won by John Cuthbertson, who served until the end of the parliamentary term in 1875.[6]

Cuthbertson was defeated by George Lumsden in the 1875 election. Lumsden resigned in June 1878,[7] which caused the 1878 by-election. Henry Feldwick was the successful candidate and he commenced his first of three terms for the electorate.[8] At the 1879 election, Feldwick was defeated by James Walker Bain, who retired at the end of the parliamentary term in 1881.[9] At the 1881 election, Feldwick was again the successful candidate,[8] only to be defeated again at the 1884 election, on that occasion by Joseph Hatch.[10] At the 1887 election, Feldwick defeated Hatch and commenced his third and final term for the Invercargill electorate, serving until the end of the parliamentary term in 1890.[8]

James Whyte Kelly defeated Feldwick in the 1890 election. Kelly became a member of the Liberal Party and served for three parliamentary terms,[8] but broke away from the Liberal Party and became an Independent Liberal in 1895.[11] For the 1899 election, the Josiah Hanan of the Liberal Party challenged Kelly, with Hanan being successful.[12] Hanan served the electorate until 1925, when he retired.[13]

The 1925 election was narrowly won by the former Prime Minister Sir Joseph Ward standing for the Liberal Party, who beat James Hargest of the Reform Party with 4957 votes to 4798; a third contender, Patrick Hickey, stood for the Labour Party.[14] Until 1919, Ward had for many years represented Awarua.[15] Ward, a former leader of the Liberal Party, contested the election under the "Liberal" label, despite the fact that the remnants of the Liberal Party were now calling themselves by different names.[16] In 1928, Ward helped form the United Party[16] and won the 1928 election.[15] He died on 8 July 1930,[16] which caused the 1930 by-election won by his son Vincent Ward, who retired at the end of the parliamentary term in 1931.[15]

Vincent Ward was succeeded by James Hargest in the 1931 election. At the end of the parliamentary term in 1935, Hargest successfully contested the Awarua electorate.[15] He was succeeded in the Invercargill electorate by William Denham of the Labour Party, who held the electorate for three terms from 1935[17] until his defeat in the 1946 election by Ralph Hanan of the National Party.[13] Hanan was re-elected seven times and died in office on 24 July 1969; the need to hold a by-election before the general election on 29 November was avoided by a special act, the By-election Postponement Act 1969.

The successful candidate in the 1969 general election was John Chewings, who was defeated at the end of the parliamentary term at the 1972 election by Labour's J. B. Munro. At the next election in 1975, Munro was in turn beaten by National's Norman Jones. Jones retired at the end of his fourth term in August 1987 and died shortly thereafter on 19 November.[18]

Jones was succeeded by National's Rob Munro in the 1987 election. Munro served two parliamentary terms before being beaten by Labour's Mark Peck in the 1993 election. Peck retired after four parliamentary terms in 2005 and was succeeded by National's Eric Roy in the 2005 election. Roy retired after three parliamentary terms and was succeeded in 2014 by Sarah Dowie.[19]

Members of Parliament edit

Key

  Independent   Liberal   Liberal–Labour

  United   Labour   National   NZ First

Election Winner
1866 election William Wood
1871 election William Henderson Calder
1873 by-election John Cuthbertson
1875 election George Lumsden
1878 by-election Henry Feldwick
1879 election James Walker Bain
1881 election Henry Feldwick (2nd time)
1884 election Joseph Hatch
1887 election Henry Feldwick (3rd time)
1890 election James Whyte Kelly
1893 election
1896 election
1899 election Josiah Hanan
1902 election
1905 election
1908 election
1911 election
1914 election
1919 election
1922 election
1925 election Joseph Ward
1928 election
1930 by-election Vincent Ward
1931 election James Hargest
1935 election William Denham
1938 election
1943 election
1946 election Ralph Hanan
1949 election
1951 election
1954 election
1957 election
1960 election
1963 election
1966 election
1969 election John Chewings
1972 election J. B. Munro
1975 election Norman Jones
1978 election
1981 election
1984 election
1987 election Rob Munro
1990 election
1993 election Mark Peck
1996 election
1999 election
2002 election
2005 election Eric Roy
2008 election
2011 election
2014 election Sarah Dowie
2017 election
2020 election Penny Simmonds
2023 election

List MPs edit

Members of Parliament elected from party lists in elections where that person also unsuccessfully contested the Invercargill electorate. Unless otherwise stated, all MPs terms began and ended at general elections.

Election Winner
1996 election Eric Roy
1999 election
2015 Ria Bond[a]
2017 election Liz Craig
2020 election

Election results edit

2020 election edit

2020 general election: Invercargill[20]
Notes:

Blue background denotes the winner of the electorate vote.
Pink background denotes a candidate elected from their party list.
Yellow background denotes an electorate win by a list member, or other incumbent.
A  Y or  N denotes status of any incumbent, win or lose respectively.

Party Candidate Votes % ±% Party votes % ±%
National Penny Simmonds 17,929 44.66 −6.39 11,996 29.74 −18.65
Labour Liz Craig 17,705 44.10 +8.79 19,252 47.73 +11.91
Green Rochelle Francis 1,137 2.83 −1.75 1,386 3.44 +0.2
New Conservative Joshua Honiss 757 1.88 862 2.14 –1.92
NZ First Joshua Gunn 735 1.83 –7.23 1,218 3.02 −5.70
Advance NZ Kurt Rohloff 417 1.04 406 1.01
ONE Jackie West 237 0.59 158 0.39
Social Credit Winsome Aroha 206 0.51 81 0.20 +0.08
Independent Basil Walker 187 0.46
Independent Zy Haden 102 0.25
ACT   3,846 9.52 +9.27
Opportunities   433 1.07 –1.04
Legalise Cannabis   220 0.55 +0.16
Māori Party   76 0.19 −0.01
Outdoors   44 0.11 +0.06
Sustainable NZ   20 0.05
TEA   16 0.04
Heartland   8 0.019
Vision NZ   8 0.019
Informal votes 735 308
Total valid votes 35,462 35,990
Turnout 40,338
National hold Majority 224 0.56 −15.17

2017 election edit

2017 general election: Invercargill[21]
Notes:

Blue background denotes the winner of the electorate vote.
Pink background denotes a candidate elected from their party list.
Yellow background denotes an electorate win by a list member, or other incumbent.
A  Y or  N denotes status of any incumbent, win or lose respectively.

Party Candidate Votes % ±% Party votes % ±%
National  Y Sarah Dowie 18,102 51.05 −0.43 17,414 48.39 −0.87
Labour Liz Craig 12,523 35.31 +5.81 12,891 35.82 +10.86
NZ First Ria Bond 3,214 9.06 +1.64 3,139 8.72 −2.39
Green Rochelle Surendran 1,623 4.58 −2.75 1,166 3.24 −4.29
Opportunities   760 2.11
Legalise Cannabis   141 0.39 −0.26
Ban 1080   103 0.29 −0.21
ACT   95 0.26 −0.07
Conservative   79 0.22 −3.45
Māori Party   73 0.20 −0.12
Democrats   43 0.12 −0.16
United Future   27 0.08 −0.12
Outdoors   23 0.06
People's Party   21 0.06
Internet   9 0.03 −0.58[b]
Mana Party   6 0.02 −0.59[c]
Informal votes 445 163
Total valid votes 35,462 35,990
Turnout 36,153
National hold Majority 5,579 15.73 −6.25

2014 election edit

2014 general election: Invercargill[22]
Notes:

Blue background denotes the winner of the electorate vote.
Pink background denotes a candidate elected from their party list.
Yellow background denotes an electorate win by a list member, or other incumbent.
A  Y or  N denotes status of any incumbent, win or lose respectively.

Party Candidate Votes % ±% Party votes % ±%
National Sarah Dowie 17,526 51.48 −3.10 16,880 49.26 −0.62
Labour Lesley Soper 10,044 29.50 −5.29 8,553 24.96 −3.77
NZ First Ria Bond[a] 2,526 7.42 +7.42 3,806 11.11 +4.27
Green David Kennedy 2,497 7.33 −0.36 2,581 7.53 −0.89
Conservative Laura Storr 719 2.11 +2.11 1,256 3.67 +2.68
Democrats Stephnie de Ruyter 333 0.98 −0.67 95 0.28 −0.12
Legalise Cannabis   224 0.65 −0.14
Internet Mana   210 0.61 +0.42[d]
Ban 1080   173 0.50 −0.32
ACT   113 0.33 −0.90
Māori Party   110 0.32 −0.18
United Future   68 0.20 −0.62
Civilian   23 0.07 +0.07
Independent Coalition   11 0.03 +0.03
Focus   10 0.03 +0.03
Informal votes 400 153
Total valid votes 34,045 34,266
Turnout 34,292 76.48 +4.60
National hold Majority 7,482 21.98 +2.19

2011 election edit

2011 general election: Invercargill[23]
Notes:

Blue background denotes the winner of the electorate vote.
Pink background denotes a candidate elected from their party list.
Yellow background denotes an electorate win by a list member, or other incumbent.
A  Y or  N denotes status of any incumbent, win or lose respectively.

Party Candidate Votes % ±% Party votes % ±%
National  Y Eric Roy 17,275 54.58 -1.39 16,140 49.88 +2.35
Labour Lesley Soper 11,012 34.79 -1.96 9,296 28.73 -8.15
Green David Kennedy 2,433 7.69 +2.73 2,723 8.42 +4.16
Democrats Stephnie de Ruyter 521 1.65 +1.65 129 0.40 +0.22
ACT Ian Carline 276 0.87 -0.33 397 1.23 -1.47
Libertarianz Shane Pleasance 133 0.42 +0.04 34 0.11 +0.05
NZ First   2,213 6.84 +3.44
Conservative   643 1.99 +1.99
United Future   264 0.82 -0.09
Legalise Cannabis   257 0.79 +0.28
Māori Party   162 0.50 -0.08
Mana   63 0.19 +0.19
Alliance   34 0.11 -0.05
Informal votes 863 324
Total valid votes 31,650 32,355
National hold Majority 6,263 19.79 0.58

Electorate (as at 26 November 2011): 45,014[24]

2008 election edit

2008 general election: Invercargill[25]
Notes:

Blue background denotes the winner of the electorate vote.
Pink background denotes a candidate elected from their party list.
Yellow background denotes an electorate win by a list member, or other incumbent.
A  Y or  N denotes status of any incumbent, win or lose respectively.

Party Candidate Votes % ±% Party votes % ±%
National  Y Eric Roy 19,414 55.97 +6.46 16,663 47.54 +8.05
Labour Lesley Soper 12,750 36.76 -6.22 12,927 36.88 -8.30
Green Craig Carson 1,718 4.95 +2.07 1,492 4.26 +1.18
ACT Ian Carline 416 1.20 +0.06 947 2.70 +1.55
United Future Maureen Smith 258 0.74 -0.70 319 0.91 -2.31
Libertarianz Shane Pleasance 131 0.38 21 0.06 +0.03
NZ First   1,192 3.40 -1.41
Bill and Ben   413 1.18
Progressive   292 0.83 -0.39
Māori Party   205 0.58 +0.25
Legalise Cannabis   179 0.51 +0.21
Family Party   145 0.41
Kiwi   105 0.30
Democrats   61 0.17 -0.02
Alliance   54 0.15 +0.08
Pacific   18 0.05
Workers Party   14 0.04
RONZ   4 0.01 -0.00
RAM   1 0.00
Informal votes 338 143
Total valid votes 34,687 35,052
National hold Majority 6,664 19.21 +12.69

2005 election edit

2005 general election: Invercargill[26]
Notes:

Blue background denotes the winner of the electorate vote.
Pink background denotes a candidate elected from their party list.
Yellow background denotes an electorate win by a list member, or other incumbent.
A  Y or  N denotes status of any incumbent, win or lose respectively.

Party Candidate Votes % ±% Party votes % ±%
National Eric Roy 15,570 49.51 12,559 39.49
Labour Wayne Harpur 13,518 42.98 14,369 45.18
Green Craig Carson 906 2.88 980 3.08
United Future Ralph Kennard 453 1.4 1,024 3.22
ACT Ian Beker 358 1.14 365 1.15
Progressive Heka Taefu 231 0.73 388 1.22
Democrats Bruce Stirling 187 0.59 63 0.20
Māori Party Gina Haremate-Crawford 163 0.52 106 0.33
Direct Democracy Craig Guy 65 0.21 11 0.03
NZ First   1,530 4.81
Destiny   188 0.59
Legalise Cannabis   96 0.30
Christian Heritage   56 0.19
Alliance   22 0.07
One NZ   13 0.04
Family Rights   11 0.03
Libertarianz   10 0.03
99 MP   9 0.03
RONZ   5 0.02
Informal votes 316 111
Total valid votes 31,451 31,805
National gain from Labour Majority 2,052 6.52

2002 election edit

2002 general election: Invercargill
Notes:

Blue background denotes the winner of the electorate vote.
Pink background denotes a candidate elected from their party list.
Yellow background denotes an electorate win by a list member, or other incumbent.
A  Y or  N denotes status of any incumbent, win or lose respectively.

Party Candidate Votes % ±% Party votes % ±%
Labour  Y Mark Peck 14,548 48.77 -8.31 14,089 46.73 +1.80
National Eric Roy 11,756 39.41 +7.71 8,021 26.60 -3.32
Progressive Stephnie de Ruyter 1,006 3.37 -1.61[e] 760 2.52
Green Craig Carson 963 3.23 +1.04 1,298 4.30 +1.22
United Future Vince Smith 806 2.70 1,851 6.14
ACT Peter Phiskie 313 1.05 1,073 3.56 +0.23
Christian Heritage Mervyn Lemuel Clayton 235 0.79 301 1.00 -1.63
Alliance Anna McMartin 202 0.68 241 0.80 -9.11
NZ First   1,838 6.10 +3.33
ORNZ   444 1.47
Legalise Cannabis   219 0.73 -0.45
One NZ   14 0.05 +0.01
Mana Māori   2 0.01 -0.02
NMP   1 0.00 0.00
Informal votes 296 108
Total valid votes 29,829 30,152
Labour hold Majority 2,792 9.36 -16.02

1999 election edit

1999 general election: Invercargill
Notes:

Blue background denotes the winner of the electorate vote.
Pink background denotes a candidate elected from their party list.
Yellow background denotes an electorate win by a list member, or other incumbent.
A  Y or  N denotes status of any incumbent, win or lose respectively.

Party Candidate Votes % ±% Party votes % ±%
Labour  Y Mark Peck 17,970 57.08 +8.25 14,196 44.93 +11.69
National Eric Roy 9,980 31.70 -3.69 9,453 29.92 -4.34
Alliance Stephnie de Ruyter 1,567 4.98 3,132 9.91 +0.15
Green Craig William Carson 689 2.19 974 3.08
Christian Heritage Russell Zwies 536 1.70 832 2.63
NZ First Allan Wise 488 1.55 875 2.77 -9.12
ACT Matt McInnes 251 0.80 1,051 3.33 +0.41
Legalise Cannabis   372 1.18 -0.47
Christian Democrats   245 0.78
South Island   157 0.50
Libertarianz   92 0.29 +0.26
United NZ   86 0.27 -0.21
Animals First   44 0.14 -0.01
McGillicuddy Serious   44 0.14 -0.19
Natural Law   13 0.04 -0.12
One NZ   13 0.04
Mana Māori   8 0.03 +0.02
The People's Choice   5 0.02
Mauri Pacific   2 0.01
Freedom Movement   1 0.00
NMP   0 0.00
Republican   0 0.00
Informal votes 431 317
Total valid votes 31,481 31,595
Labour hold Majority 7,991 25.38 +11.94

1996 election edit

1996 general election: Invercargill[27][28][29]
Notes:

Blue background denotes the winner of the electorate vote.
Pink background denotes a candidate elected from their party list.
Yellow background denotes an electorate win by a list member, or other incumbent.
A  Y or  N denotes status of any incumbent, win or lose respectively.

Party Candidate Votes % ±% Party votes % ±%
Labour  Y Mark Peck 15,383 48.83 10,502 33.24
National  N Eric Roy 11,148 35.39 10,825 34.26
NZ First Owen Horton 2,302 7.31 3,757 11.89
Alliance Bruce Stirling 1,536 4.88 3,083 9.76
ACT Louis Crimp 441 1.40 921 2.92
Independent Philip Jones 294 0.93
McGillicuddy Serious Anthony Hobbs 200 0.63 105 0.33
United NZ Stuart Jordan 111 0.35 153 0.48
Natural Law Jacque Hughes 87 0.28 49 0.16
Christian Coalition   1,495 4.73
Legalise Cannabis   521 1.65
Progressive Green   60 0.19
Animals First   47 0.15
Green Society   26 0.08
Conservatives   14 0.04
Superannuitants & Youth   11 0.03
Libertarianz   8 0.03
Advance New Zealand 6 0.02
Mana Māori   4 0.01
Te Tawharau 4 0.01
Asia Pacific United 2 0.01
Ethnic Minority Party 1 0.00
Informal votes 207 115
Total valid votes 31,502 31,594
Labour hold Majority 4,235 13.44

1993 election edit

1993 general election: Invercargill[30]
Party Candidate Votes % ±%
Labour Mark Peck 8,477 43.66
National Rob Munro 7,303 37.61 -9.05
Alliance Cecily Treweek 2,250 11.58 +8.72
Independent Philip Jones 702 3.61
NZ First K Kawe 393 2.02
Christian Heritage H Macann 242 1.24
Natural Law Rhonda-Lisa Comins 48 0.24
Majority 1,174 6.04
Turnout 19,415 84.29 +0.02
Registered electors 23,033

1990 election edit

1990 general election: Invercargill[31]
Party Candidate Votes % ±%
National Rob Munro 10,727 46.66 -2.06
Labour Barry Rait 6,590 28.66
NewLabour J Moore 746 3.24
Democrats Cecily Treweek 659 2.86 -5.82
Social Credit H M Thompson 334 1.45
Legalise Marijuana K Dreaver 319 1.38
Majority 4,137 17.99 +15.34
Turnout 19,375 84.27 -6.17
Registered electors 22,989

1987 election edit

1987 general election: Invercargill[32]
Party Candidate Votes % ±%
National Rob Munro 10,115 48.72
Labour Dougal Soper 9,563 46.06 +5.29
Democrats Cecily Treweek 1,803 8.68
Majority 552 2.65
Turnout 20,761 90.44 -3.36
Registered electors 22,955

1984 election edit

1984 general election: Invercargill[32]
Party Candidate Votes % ±%
National Norman Jones 9,805 46.89 +1.26
Labour Dougal Soper 8,526 40.77 +2.91
NZ Party Maurice Coughlan 1,721 8.23
Social Credit Joe Radich 801 3.83 -12.67
Independent G J Gilbert 56 0.26
Majority 1,279 6.11 +1.65
Turnout 20,909 93.80 +2.58
Registered electors 22,291

1981 election edit

1981 general election: Invercargill[32]
Party Candidate Votes % ±%
National Norman Jones 9,350 45.63 -2.33
Labour Dougal Soper 7,758 37.86
Social Credit Joe Radich 3,382 16.50 +2.71
Majority 1,592 7.76 +6.49
Turnout 20,490 91.22 +16.45
Registered electors 22,460

1978 election edit

1978 general election: Invercargill[32]
Party Candidate Votes % ±%
National Norman Jones 8,666 43.30 -9.28
Labour Aubrey Begg 8,410 42.02
Social Credit Joe Radich 2,760 13.79
Values R J Thomson 175 0.87
Majority 256 1.27 -12.44
Turnout 20,011 74.77 -11.06
Registered electors 26,762

1975 election edit

1975 general election: Invercargill[32]
Party Candidate Votes % ±%
National Norman Jones 9,713 52.58
Labour J. B. Munro 7,180 38.87 -9.81
Social Credit N G Green 1,045 5.65
Values Malcolm Blair 533 2.88
Majority 2,533 13.71
Turnout 18,471 85.83 -6.33
Registered electors 21,518

1972 election edit

1972 general election: Invercargill[32]
Party Candidate Votes % ±%
Labour J. B. Munro 8,125 48.68
National John Chewings 7,360 44.09 -3.74
Social Credit M L Patterson 855 5.12
Independent Labour W F Manson 251 1.50
Liberal Reform H W I Le Page 60 0.35
New Democratic J Murphy 39 0.23
Majority 765 4.58
Turnout 16,690 92.16 +3.77
Registered electors 18,108

1969 election edit

1969 general election: Invercargill[33]
Party Candidate Votes % ±%
National John Chewings 7,699 47.83
Labour Trevor Young 6,668 41.42
Social Credit D L Steele 1,728 10.73 +6.15
Majority 1,031 6.40
Turnout 16,095 88.39 +2.78
Registered electors 18,209

1966 election edit

1966 general election: Invercargill[33]
Party Candidate Votes % ±%
National Ralph Hanan 7,626 49.30 -0.87
Labour Noel Valentine 5,230 33.81
Social Credit D L Steele 2,611 16.88 +11.69
Majority 2,396 15.49 +3.18
Turnout 15,467 85.61 -4.40
Registered electors 18,066

1963 election edit

1963 general election: Invercargill[33]
Party Candidate Votes % ±%
National Ralph Hanan 7,879 50.17 -4.18
Labour Oliver James Henderson 5,945 37.85 -3.62
Liberal Ronald MacGregor Hutton-Potts 1,064 6.77
Social Credit D L Steele 815 5.19 +1.02
Majority 1,934 12.31 +0.56
Turnout 15,703 90.01 +0.74
Registered electors 17,445

1960 election edit

1960 general election: Invercargill[33]
Party Candidate Votes % ±%
National Ralph Hanan 8,128 54.35 +4.34
Labour Oliver James Henderson 6,202 41.47
Social Credit D L Steele 624 4.17
Majority 1,926 12.87 +8.39
Turnout 14,954 89.27 -3.75
Registered electors 16,751

1957 election edit

1957 general election: Invercargill[33]
Party Candidate Votes % ±%
National Ralph Hanan 7,577 50.01 +6.25
Labour Thomas Francis Doyle 6,898 45.53
Social Credit Leslie G. Russell 673 4.44 -14.87
Majority 679 4.48 -2.37
Turnout 15,148 93.02 +2.65
Registered electors 16,284

1954 election edit

1954 general election: Invercargill[33]
Party Candidate Votes % ±%
National Ralph Hanan 6,020 43.76 -13.66
Labour William Denham 5,077 36.91
Social Credit Leslie G. Russell 2,657 19.31
Majority 943 6.85 -8.00
Turnout 13,754 90.37 +0.69
Registered electors 15,218

1951 election edit

1951 General election: Invercargill[33]
Party Candidate Votes % ±%
National Ralph Hanan 8,208 57.42 +3.47
Labour F G Spurdle 6,085 42.57
Majority 2,123 14.85 +6.94
Turnout 14,293 89.68 -5.27
Registered electors 15,937

1949 election edit

1949 general election: Invercargill[34]
Party Candidate Votes % ±%
National Ralph Hanan 7,897 53.95 +3.18
Labour William Denham 6,738 46.04 -3.18
Majority 1,159 7.91 +6.36
Turnout 14,635 94.95 +0.86
Registered electors 15,412

1946 election edit

1946 general election: Invercargill[35]
Party Candidate Votes % ±%
National Ralph Hanan 7,315 50.77
Labour William Denham 7,091 49.22 -2.12
Majority 224 1.55
Turnout 14,406 94.09 -3.34
Registered electors 15,310

1943 election edit

1943 general election: Invercargill[36]
Party Candidate Votes % ±%
Labour William Denham 7,442 51.34 -5.42
National William Bell 6,435 44.40
Democratic Labour L. Assheton Harbord 523 3.60
Informal votes 113 0.77 +0.40
Majority 1,007 6.94 -8.17
Turnout 14,493 97.43 +1.47
Registered electors 14,874

1938 election edit

1938 general election: Invercargill[37]
Party Candidate Votes % ±%
Labour William Denham 8,094 56.76 +26.21
National Fred Hall-Jones 5,938 41.64
Independent George Edward Thompson Dorman 174 1.22
Informal votes 54 0.37 -0.29
Majority 2,156 15.11 +12.54
Turnout 14,260 95.96 +1.28
Registered electors 14,860

1935 election edit

1935 general election: Invercargill[38]
Party Candidate Votes % ±%
Labour William Denham 4,241 31.55 +4.98
Democrat Gordon Reed 3,895 28.98
Reform John Miller 2,708 20.15
Independent Liberal William McChesney 2,595 19.30 -15.30
Informal votes 90 0.66 0.35
Majority 346 2.57
Turnout 13,439 94.68 +7.16
Registered electors 14,194

1931 election edit

1931 general election: Invercargill[39]
Party Candidate Votes % ±%
Independent James Hargest 4,652 38.84 -8.25
United William McChesney 4,144 34.60
Labour William Denham 3,182 26.57
Majority 508 4.24 -1.58
Informal votes 37 0.31 +0.05
Turnout 12,015 87.52 +8.02
Registered electors 13,729

1930 by-election edit

1930 Invercargill by-election[40]
Party Candidate Votes % ±%
United Vincent Ward 5,194 52.91
Reform James Hargest 4,623 47.09
Majority 571 5.82
Informal votes 25 0.25 -0.51
Turnout 9,842 79.50 -13.62
Registered electors 12,380

1928 election edit

1928 general election: Invercargill[41][42]
Party Candidate Votes % ±%
United Joseph Ward 7,309 63.89 +16.98
Reform Morell Macalister 4,131 36.11
Majority 3,178 27.78 +26.27
Informal votes 88 0.76 +0.25
Turnout 11,528 93.12 -0.61
Registered electors 12,380

1925 election edit

1925 general election: Invercargill[14][43][44]
Party Candidate Votes % ±%
Liberal Joseph Ward 4,957 46.91
Reform James Hargest 4,798 45.41
Labour Pat Hickey 811 7.68
Majority 159 1.50 -9.22
Informal votes 55 0.52 -0.34
Turnout 10,621 93.73 +3.44
Registered electors 11,332

1899 election edit

1899 general election: Invercargill[45]
Party Candidate Votes % ±%
Liberal Josiah Hanan 2,451 52.82
Liberal–Labour James Whyte Kelly 2,189 47.18 -2.07
Majority 262 5.65 -7.08
Turnout 4,640 79.94 +1.02
Registered electors 5,804

1896 election edit

1896 general election: Invercargill[46]
Party Candidate Votes % ±%
Liberal–Labour James Whyte Kelly 2,237 49.25 -17.98
Liberal John Sinclair 1,659 36.53
Conservative William Benjamin Scandrett 646 14.22
Majority 578 12.73 -21.74
Turnout 4,542 78.92 +0.71
Registered electors 5,755

1893 election edit

1893 general election: Invercargill[47][48]
Party Candidate Votes % ±%
Liberal–Labour James Whyte Kelly 2,423 67.23 +25.48
Independent Joseph Hatch 1,181 32.77
Majority 1,242 34.46 +26.61
Turnout 3,604 78.21 +4.48
Registered electors 4,608

1890 election edit

1890 general election: Invercargill[49]
Party Candidate Votes % ±%
Liberal–Labour James Whyte Kelly 633 41.75
Conservative James Walker Bain 517 34.10
Liberal Henry Feldwick 366 24.15
Majority 116 7.65
Turnout 1,516 73.73
Registered electors 2,056

1878 by-election edit

1878 Invercargill by-election[50]
Party Candidate Votes % ±%
Independent Henry Feldwick 230 51.22 +51.22
Independent James Walker Bain 219 48.78 +48.78
Majority 11 2.45
Turnout 449

1875 election edit

1875 general election: Invercargill[51]
Party Candidate Votes % ±%
Independent George Lumsden 180 53.10 +53.10
Independent John Cuthbertson 159 46.90 −5.58
Majority 21 6.19
Turnout 339

1873 by-election edit

1873 Invercargill by-election[52]
Party Candidate Votes % ±%
Independent John Cuthbertson 159 52.48
Independent William Wood 144 47.52
Majority 15 4.95
Turnout 303

1871 election edit

1871 general election: Invercargill[53]
Party Candidate Votes % ±%
Independent William Henderson Calder 142 61.21 +61.21
Independent George Lumsden 90 38.79 +38.79
Majority 52 22.41
Turnout 232

1866 election edit

1866 general election: Invercargill[54]
Party Candidate Votes % ±%
Independent William Wood 75 50.67
Independent Theophilus Heale 73 49.32
Majority 2 1.35
Turnout 148

Table footnotes edit

  1. ^ a b Bond entered parliament as a list MP on 28 April 2015 after Winston Peters won the 2015 Northland by-election.
  2. ^ 2017 Internet Party swing is relative to the votes for Internet-Mana in 2014; it shared a party list with Mana Party in the 2014 election
  3. ^ 2017 Mana Party swing is relative to the votes for Internet-Mana in 2014; it shared a party list with the Internet Party in the 2014 election
  4. ^ 2014 Internet Mana swing is relative to the votes for Mana in 2011; it shared a party list with Internet in the 2014 election.
  5. ^ Percentage change calculated as a candidate for the Alliance Party in the 1999 election

Notes edit

  1. ^ Report of the Representation Commission 2014 (PDF). Representation Commission. 4 April 2014. p. 10. ISBN 978-0-477-10414-2. Archived from the original (PDF) on 6 October 2014. Retrieved 26 September 2014.
  2. ^ "Report of the Representation Commission 2020" (PDF). 17 April 2020.
  3. ^ Scholefield 1950, p. 159.
  4. ^ Scholefield 1950, p. 149.
  5. ^ Scholefield 1950, p. 99.
  6. ^ Scholefield 1950, p. 102.
  7. ^ Scholefield 1950, p. 120.
  8. ^ a b c d Scholefield 1950, p. 105.
  9. ^ Scholefield 1950, p. 94.
  10. ^ Scholefield 1950, p. 112.
  11. ^ "The New Parliament". Otago Witness. No. 2232. 10 December 1896. p. 20. Retrieved 7 January 2014.
  12. ^ "The Invercargill Seat". Colonist. Vol. XLIII, no. 9659. 12 December 1899. p. 3. Retrieved 24 November 2011.
  13. ^ a b Scholefield 1950, p. 111.
  14. ^ a b The General Election, 1925. Government Printer. 1926. p. 5. Retrieved 20 November 2014.
  15. ^ a b c d Scholefield 1950, p. 146.
  16. ^ a b c Bassett, Michael. "Ward, Joseph George 1856–1930". Dictionary of New Zealand Biography. Ministry for Culture and Heritage. Retrieved 26 November 2011.
  17. ^ Scholefield 1950, p. 103.
  18. ^ "Obituary—N. P. H. Jones". VDIG group. Retrieved 25 November 2011.
  19. ^ Berwick, Louise; Mcdougall, Nicci; Mcleod, Hannah (20 September 2014). "Soper won't stand again as Dowie wins city vote". The Southland Times. Retrieved 26 September 2014.
  20. ^ "Invercargill - Official Result". Electoral Commission. n.d. Retrieved 7 January 2021.
  21. ^ "Official Count Results -- Invercargill (2017)". Electoral Commission. 7 October 2017. Retrieved 9 October 2017.
  22. ^ "Official Count Results – Invercargill (2014)". Electoral Commission. Retrieved 1 April 2016.
  23. ^ Invercargill results, 2011
  24. ^ "Enrolment statistics". Electoral Commission. 26 November 2011. Archived from the original on 10 November 2011. Retrieved 26 November 2011.
  25. ^ 2008 election results Archived 11 December 2008 at the Wayback Machine
  26. ^ "Official Count Results -- Invercargill". Electoral Commission. 1 October 2005. Retrieved 6 October 2017.
  27. ^ "Electorate Candidate and Party Votes Recorded at Each Polling Place – Invercargill, 1996" (PDF). Retrieved 13 July 2013.
  28. ^ "Part III – Party Lists of Successful Registered Parties" (PDF). Electoral Commission. Archived from the original (PDF) on 8 February 2013. Retrieved 22 June 2013.
  29. ^ "Part III – Party Lists of unsuccessful Registered Parties" (PDF). Electoral Commission. Archived from the original (PDF) on 8 February 2013. Retrieved 22 June 2013.
  30. ^ Part 1: Votes recorded at each polling place (Technical report). New Zealand Chief Electoral Office. 1993. p. 46.
  31. ^ Part 1: Votes recorded at each polling place (Technical report). New Zealand Chief Electoral Office. 1990.
  32. ^ a b c d e f Norton 1988, p. 254.
  33. ^ a b c d e f g Norton 1988, p. 253.
  34. ^ "The General Election, 1949". National Library. 1950. pp. 1–5, 8. Retrieved 3 January 2014.
  35. ^ "The General Election, 1946". National Library. 1947. pp. 1–11, 14. Retrieved 1 January 2014.
  36. ^ "The General Election, 1943". National Library. 1944. p. 11. Retrieved 28 March 2014.
  37. ^ "The General Election, 1938". National Library. 1939. pp. 1–6. Retrieved 8 February 2012.
  38. ^ The General Election, 1935. Government Printer. 1936. Retrieved 2 November 2014.
  39. ^ The General Election, 1931. Government Printer. 1932. p. 3. Retrieved 2 November 2014.
  40. ^ "Invercargill Seat". The Evening Post. Vol. CX, no. 44. 20 August 1930. p. 10. Retrieved 19 October 2013.
  41. ^ "General Election". The Evening Post. Vol. CVI, no. 121. 27 November 1928. p. 14. Retrieved 19 October 2013.
  42. ^ The General Election, 1928. Government Printer. 1929. p. 3. Retrieved 4 December 2013.
  43. ^ "Missing Votes in Lyttelton Election". Auckland Star. Vol. LVI, no. LVI. 13 November 1925. p. 8. Retrieved 19 October 2013.
  44. ^ "Amended Results". The Evening Post. Vol. CX, no. 117. 13 November 1925. p. 6. Retrieved 19 October 2013.
  45. ^ "The General Election, 1899". Wellington: Appendix to the Journals of the House of Representatives. 19 June 1900. p. 3. Retrieved 12 February 2014.
  46. ^ "Otago". Auckland Star. Vol. XXVII, no. 305. 23 December 1896. p. 6. Retrieved 6 January 2014.
  47. ^ "The General Election, 1893". National Library. 1894. p. 3. Retrieved 19 November 2013.
  48. ^ "The General Election". Otago Daily Times. 28 November 1893. p. 6. Retrieved 28 November 2013.
  49. ^ "The General Election, 1890". National Library. 1891. Retrieved 25 February 2012.
  50. ^ "Invercargill Election". Grey River Argus. Vol. 21, no. 3097. 19 July 1878. p. 2. Retrieved 13 August 2013.
  51. ^ "Invercargill 25th December". The Evening Post. Vol. XII, no. 152. 28 December 1875. p. 2. Retrieved 13 August 2013.
  52. ^ "The Invercargill Election". The Southland Times. No. 1744. 23 May 1873. p. 2. Retrieved 13 August 2013.
  53. ^ "Invercargill Election". Daily Southern Cross. Vol. XXVII, no. 4199. 28 January 1871. p. 2. Retrieved 13 August 2013.
  54. ^ "Invercargill Election". The Southland Times. 12 March 1866.

References edit

  • Norton, Clifford (1988). New Zealand Parliamentary Election Results 1946-1987: Occasional Publications No 1, Department of Political Science. Wellington: Victoria University of Wellington. ISBN 0-475-11200-8.
  • Scholefield, Guy (1950) [1913]. New Zealand Parliamentary Record, 1840–1949 (3rd ed.). Wellington: Govt. Printer.