


Summary
The 2012 United States presidential election in Maryland took place on November 6, 2012, as part of the 2012 United States presidential election in which all 50 states plus the District of Columbia participated. Maryland voters chose 10 electors to represent them in the Electoral College via a popular vote pitting incumbent Democratic President Barack Obama and his running mate, Vice President Joe Biden, against Republican challenger and former Massachusetts Governor Mitt Romney and his running mate, Congressman Paul Ryan.
| ||||||||||||||||||||||||||
| Turnout | 74.00% | |||||||||||||||||||||||||
|---|---|---|---|---|---|---|---|---|---|---|---|---|---|---|---|---|---|---|---|---|---|---|---|---|---|---|
| ||||||||||||||||||||||||||
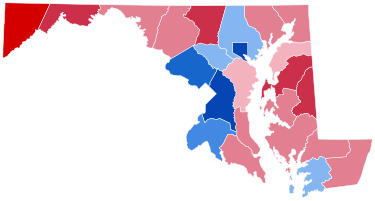 County Results
| ||||||||||||||||||||||||||
| ||||||||||||||||||||||||||


Maryland is one of six states where Obama did better in 2012 than in 2008, with his percentage of the vote increasing from 61.92% to 61.97%. He managed to flip Somerset County but lost Kent County which he won in 2008. In this election, Maryland voted 22.21% to the left of the nation at-large.[2]
As of the 2020 presidential election, this is the last time a Republican won Anne Arundel County and a Democrat won Somerset County.
Primary elections edit
Democratic primary edit
Republican primary edit
| |||||||||||||||||||||||||||||||||||||||||
| |||||||||||||||||||||||||||||||||||||||||
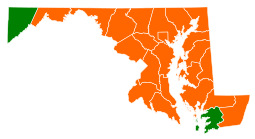 Maryland results by county
Mitt Romney
Rick Santorum | |||||||||||||||||||||||||||||||||||||||||

The Republican primary took place on April 3, 2012, the same day as the District of Columbia Republican primary and the Wisconsin Republican primary.[3] After the primary, 37 delegates were selected to attend the Republican National Convention.
| Candidate | Votes | Percentage | Delegates |
|---|---|---|---|
| 117,527 | 49.2% | 37 | |
| Rick Santorum | 69,020 | 28.9% | 0 |
| Newt Gingrich | 26,088 | 10.9% | 0 |
| Ron Paul | 22,698 | 9.5% | 0 |
| Jon Huntsman, Jr. | 1,406 | 0.6% | 0 |
| Rick Perry | 1,041 | 0.4% | 0 |
| Buddy Roemer | 858 | 0.4% | 0 |
| Fred Karger | 342 | 0.1% | 0 |
| Unprojected delegates: | 3 | ||
| Total: | 238,987 | 100% | 37 |
Green primary edit
| Candidate | Delegates | Percentage |
|---|---|---|
| Jill Stein | 5 | 83% |
| Roseanne Barr | 1 | 17% |
| Others | - | - |
| Total | 6 | 100% |
Libertarian primary edit
| Candidate | Delegates | Percentage |
|---|---|---|
| Gary Johnson | 9 | 64% |
| R. Lee Wrights | 4 | 29% |
| Carl Person | 1 | 7% |
| Others | - | - |
| Total | 14 | 100% |
General Election edit
Results edit
| 2012 United States presidential election in Maryland[9] | ||||||
|---|---|---|---|---|---|---|
| Party | Candidate | Running mate | Votes | Percentage | Electoral votes | |
| Democratic | Barack Obama | Joe Biden | 1,677,844 | 61.97% | 10 | |
| Republican | Mitt Romney | Paul Ryan | 971,869 | 35.90% | 0 | |
| Libertarian | Gary Johnson | Jim Gray | 30,195 | 1.12% | 0 | |
| Green | Jill Stein | Cheri Honkala | 17,110 | 0.63% | 0 | |
| Others | 10,309 | 0.38% | 0 | |||
| Totals | 2,707,327 | 100.00% | 10 | |||
| Voter turnout (registered voters) | 69.4% | |||||
Results by county edit
| County | Barack Obama Democratic |
Mitt Romney Republican |
Various candidates Other parties |
Margin | Total votes cast | ||||
|---|---|---|---|---|---|---|---|---|---|
| # | % | # | % | # | % | # | % | ||
| Allegany | 9,805 | 32.85% | 19,230 | 64.42% | 815 | 2.73% | -9,425 | -31.57% | 29,850 |
| Anne Arundel | 126,635 | 48.68% | 126,832 | 48.75% | 6,688 | 2.57% | -197 | -0.07% | 260,155 |
| Baltimore | 220,322 | 57.26% | 154,908 | 40.26% | 9,552 | 2.48% | 65,414 | 17.00% | 384,782 |
| Baltimore City | 221,478 | 87.19% | 28,171 | 11.09% | 4,356 | 1.71% | 193,307 | 76.10% | 254,005 |
| Calvert | 20,529 | 45.10% | 23,952 | 52.62% | 1,037 | 2.28% | -3,423 | -7.52% | 45,518 |
| Caroline | 4,970 | 37.21% | 8,098 | 60.63% | 289 | 2.16% | -3,128 | -23.42% | 13,357 |
| Carroll | 27,939 | 31.92% | 56,761 | 64.84% | 2,836 | 3.24% | -28,822 | -32.92% | 87,536 |
| Cecil | 16,557 | 38.98% | 24,806 | 58.39% | 1,117 | 2.63% | -8,249 | -19.41% | 42,480 |
| Charles | 48,774 | 64.84% | 25,178 | 33.47% | 1,270 | 1.69% | 23,596 | 31.37% | 75,222 |
| Dorchester | 7,257 | 46.99% | 7,976 | 51.64% | 211 | 1.37% | -719 | -4.65% | 15,444 |
| Frederick | 55,146 | 47.09% | 58,798 | 50.21% | 3,171 | 2.71% | -3,652 | -3.12% | 117,115 |
| Garrett | 3,124 | 23.74% | 9,743 | 74.05% | 290 | 2.20% | -6,619 | -50.31% | 13,157 |
| Harford | 49,729 | 39.48% | 72,911 | 57.89% | 3,314 | 2.63% | -23,182 | -18.41% | 125,954 |
| Howard | 91,393 | 59.69% | 57,758 | 37.72% | 3,957 | 2.58% | 33,635 | 21.97% | 153,108 |
| Kent | 4,842 | 48.89% | 4,870 | 49.17% | 192 | 1.94% | -28 | -0.28% | 9,904 |
| Montgomery | 323,400 | 70.92% | 123,353 | 27.05% | 9,239 | 2.03% | 200,047 | 43.87% | 455,992 |
| Prince George's | 347,938 | 89.73% | 35,734 | 9.22% | 4,072 | 1.05% | 312,204 | 80.51% | 387,744 |
| Queen Anne's | 8,556 | 34.38% | 15,823 | 63.58% | 509 | 2.05% | -7,267 | -29.20% | 24,888 |
| St. Mary's | 19,711 | 41.22% | 26,797 | 56.03% | 1,316 | 2.75% | -7,086 | -14.81% | 47,824 |
| Somerset | 5,240 | 50.39% | 5,042 | 48.49% | 117 | 1.13% | 198 | 1.90% | 10,399 |
| Talbot | 8,808 | 43.05% | 11,339 | 55.42% | 312 | 1.53% | -2,531 | -12.37% | 20,459 |
| Washington | 25,042 | 39.90% | 36,074 | 57.48% | 1,639 | 2.61% | -11,032 | -17.58% | 62,755 |
| Wicomico | 19,635 | 46.46% | 21,764 | 51.50% | 860 | 2.04% | -2,129 | -5.04% | 42,259 |
| Worcester | 11,014 | 40.17% | 15,951 | 58.17% | 455 | 1.66% | -4,937 | -18.00% | 27,420 |
| Totals | 1,677,844 | 61.97% | 971,869 | 35.90% | 57,614 | 2.13% | 705,975 | 26.07% | 2,707,327 |

| Democratic Hold Gain from Republican | Republican Hold Gain from Democratic |
Counties that flipped from Democratic to Republican edit
- Kent (largest town: Chestertown)
Counties that flipped from Republican to Democratic edit
- Somerset (largest town: Princess Anne)
By congressional district edit
Obama won 7 of the state's 8 congressional districts.[10]
| District | Obama | Romney | Representative |
|---|---|---|---|
| 1st | 37% | 60% | Andy Harris |
| 2nd | 63% | 34% | Dutch Ruppersberger |
| 3rd | 60% | 37% | John Sarbanes |
| 4th | 78% | 20% | Donna Edwards |
| 5th | 66% | 32% | Steny Hoyer |
| 6th | 55% | 42% | John Delaney |
| 7th | 76% | 22% | Elijah Cummings |
| 8th | 61% | 36% | Chris Van Hollen |
See also edit
References edit
- ^ "2012 Presidential General Election - Statewide Voter Turnout by County and Party". elections.maryland.gov.
- ^ "Dave Leip's Atlas of U.S. Presidential Elections". uselectionatlas.org. Retrieved March 31, 2023.
- ^ "Maryland Republican Primary". The New York Times. Retrieved June 8, 2015.
- ^ "2012 Primary Election Results" (PDF). Mississippi Republican Party. March 29, 2012.
- ^ "maryland Republican Primary - Election Results - Election 2012". The New York Times.
- ^ "2012 primaries - Jill Stein for President". www.jillstein.org. Archived from the original on February 15, 2015. Retrieved January 11, 2022.
- ^ Archived at Ghostarchive and the Wayback Machine: "Green Party Presidential Convention State by State Delegation Vote". YouTube.
- ^ "2012 Libertarian National Convention" (PDF). Libertarian Party. May 3–6, 2012.
- ^ "Maryland State Board of Elections". Retrieved November 10, 2012.
- ^ "Maryland 2012 pres-by-cd".