
KNOWPIA
WELCOME TO KNOWPIA

Texas's 9th congressional district 
Summary
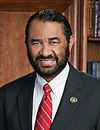
Texas's 9th congressional district of the United States House of Representatives includes the southwestern portion of the Greater Houston area in Texas. The current Representative for the district, since 2005, is Democrat Al Green.
| Texas's 9th congressional district | |||
|---|---|---|---|
 Texas's 9th congressional district since January 3, 2023 | |||
| Representative |
| ||
| Distribution |
| ||
| Population (2022) | 774,848[2] | ||
| Median household income | $63,597[3] | ||
| Ethnicity |
| ||
| Cook PVI | D+26[4] | ||
From 1967 to 2005, the 9th covered an area stretching from Galveston through Houston to Beaumont. Much of that area is now the 2nd district. Most of the area now in the 9th was in the 25th district from 1983 to 2005.
List of members representing the district edit


Election results from presidential races edit
| Year | Office | Result |
|---|---|---|
| 2000 | President | Bush 53 - 44% |
| 2004 | President | Kerry 70 - 30% |
| 2008 | President | Obama 77 - 23% |
| 2012 | President | Obama 78 - 21% |
| 2016 | President | Clinton 79 - 18% |
| 2020 | President | Biden 76 - 23% |
Election results edit
2004 edit
| Party | Candidate | Votes | % | ±% | |
|---|---|---|---|---|---|
| Democratic | Al Green | 114,462 | 72.2 | +13.6 | |
| Republican | Arlette Molina | 42,132 | 26.6 | -13.7 | |
| Libertarian | Stacey Bourland | 1,972 | 1.2 | +0.2 | |
| Majority | 72,330 | 45.6 | |||
| Turnout | 158,566 | ||||
| Democratic hold | Swing | +13.7 | |||
2006 edit
| Party | Candidate | Votes | % | ±% | |
|---|---|---|---|---|---|
| Democratic | Al Green (incumbent) | 60,253 | 100 | +27.8 | |
| Majority | 60,253 | 100 | |||
| Turnout | 60,253 | ||||
| Democratic hold | Swing | +54.4 | |||
2008 edit
| Party | Candidate | Votes | % | ±% | |
|---|---|---|---|---|---|
| Democratic | Al Green (incumbent) | 143,868 | 93.65 | -6.35 | |
| Libertarian | Brad Walters | 9,760 | 6.35 | +6.35 | |
| Majority | 134,108 | 87.30 | -12.70 | ||
| Turnout | 153,628 | ||||
| Democratic hold | Swing | ||||
2010 edit
| Party | Candidate | Votes | % | ±% | |
|---|---|---|---|---|---|
| Democratic | Al Green (incumbent) | 80,107 | 75.74 | -17.91 | |
| Republican | Steve Mueller | 24,201 | 22.88 | +22.88 | |
| Libertarian | Michael W. Hope | 1,459 | 1.38 | -4.97 | |
| Majority | 55,906 | 52.86 | -34.44 | ||
| Turnout | 105,767 | ||||
| Democratic hold | Swing | ||||
2012 edit
| Party | Candidate | Votes | % | ±% | |
|---|---|---|---|---|---|
| Democratic | Al Green (incumbent) | 144,075 | 78.49 | +2.75 | |
| Republican | Steve Mueller | 36,139 | 19.69 | -3.19 | |
| Green | Vanessa Foster | 1,743 | 0.95 | +0.95 | |
| Libertarian | John Wieder | 1,609 | 0.88 | -0.50 | |
| Majority | 107,936 | 58.80 | +5.94 | ||
| Turnout | 183,566 | ||||
| Democratic hold | Swing | ||||
2014 edit
| Party | Candidate | Votes | % | ±% | |
|---|---|---|---|---|---|
| Democratic | Al Green (incumbent) | 78,109 | 90.82 | +12.33 | |
| Libertarian | Johnny Johnson | 7,894 | 9.18 | +8.30 | |
| Majority | 70,215 | 81.64 | +22.84 | ||
| Turnout | 86,003 | ||||
| Democratic hold | Swing | ||||
2016 edit
| Party | Candidate | Votes | % | ±% | |
|---|---|---|---|---|---|
| Democratic | Al Green (incumbent) | 152,032 | 80.64 | -10.18 | |
| Republican | Jeff Martin | 36,491 | 19.36 | +19.36 | |
| Majority | 115,541 | 61.28 | -20.36 | ||
| Turnout | 188,523 | ||||
| Democratic hold | Swing | ||||
2018 edit
| Party | Candidate | Votes | % | ±% | |
|---|---|---|---|---|---|
| Democratic | Al Green (incumbent) | 136,256 | 89.06 | +8.42 | |
| Libertarian | Phil Kurtz | 5,940 | 3.88 | +3.88 | |
| Independent | Benjamin Hernandez | 5,774 | 3.77 | +3.77 | |
| Independent | Kesha Rogers | 5,031 | 3.29 | +3.29 | |
| Majority | 130,316 | 85.18 | +23.90 | ||
| Turnout | 153,001 | ||||
| Democratic hold | Swing | ||||
2020 edit
| Party | Candidate | Votes | % | |
|---|---|---|---|---|
| Democratic | Al Green (incumbent) | 172,938 | 75.5 | |
| Republican | Johnny Teague | 49,575 | 21.6 | |
| Libertarian | Joe Sosa | 6,594 | 2.9 | |
| Total votes | 229,107 | 100.0 | ||
| Democratic hold | ||||
2022 edit
| Party | Candidate | Votes | % | |
|---|---|---|---|---|
| Democratic | Al Green (incumbent) | 125,446 | 76.7 | |
| Republican | Jimmy Leon | 38,161 | 23.3 | |
| Total votes | 163,607 | 100.0 | ||
| Democratic hold | ||||
Historical district boundaries edit

2007–2013

2013–2023
From 1967 to 2005, the district included the Johnson Space Center, and from 1935 to 2005, it took in Galveston.
See also edit
References edit
- ^ "Congressional Districts Relationship Files (State-based)". U.S. Census Bureau. Archived from the original on April 2, 2013.
- ^ "My Congressional District".
- ^ "My Congressional District".
- ^ "2022 Cook PVI: District Map and List". Cook Political Report. Retrieved January 10, 2023.
- ^ "Texas Election Results - Official Results". Texas Secretary of State. Retrieved November 26, 2020.
- Martis, Kenneth C. (1989). The Historical Atlas of Political Parties in the United States Congress. New York: Macmillan Publishing Company.
- Martis, Kenneth C. (1982). The Historical Atlas of United States Congressional Districts. New York: Macmillan Publishing Company.
- Congressional Biographical Directory of the United States 1774–present
29°38′44″N 95°29′39″W / 29.64556°N 95.49417°W