


Summary
Scarborough Centre is a provincial electoral district in Ontario, Canada, that has been represented in Legislative Assembly of Ontario since 1963.
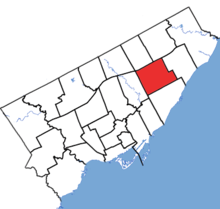 Scarborough Centre in relation to the other Toronto ridings | |||
| Coordinates: | 43°45′11″N 79°16′23″W / 43.753°N 79.273°W | ||
| Provincial electoral district | |||
| Legislature | Legislative Assembly of Ontario | ||
| MPP |
Progressive Conservative | ||
| District created | 1963 | ||
| First contested | 1963 | ||
| Last contested | 2022 | ||
| Demographics | |||
| Population (2016) | 112,600 | ||
| Electors (2018) | 75,493 | ||
| Area (km²) | 28 | ||
| Pop. density (per km²) | 4,021.4 | ||
| Census division(s) | Toronto | ||
| Census subdivision(s) | Toronto | ||


It consists of the part of the Scarborough district of the City of Toronto bounded:
- on the west by Victoria Park Avenue,
- on the north by Highway 401,
- on the east by McCowan Road, Lawrence Avenue East and Bellamy Road North, and
- on the south by Eglinton Avenue East.
Notable landmarks in Scarborough Centre include:
- Scarborough Civic Centre, site of east Toronto district council meetings, and adjacent Albert Campbell Square
- Scarborough Town Centre, a large shopping mall
- Scarborough Centre (TTC) Line 3 station
- Scarborough and Rouge Hospital, General Division
- Scarborough Museum
It was represented in the Ontario Legislature by PC Christina Mitas since 2018, who did not run for re-election in 2022.
Scarborough Centre is a bellwether riding, having voted for the winner in every election since 1971 (longer than any other provincial riding). However, it did comprise different territories, changing shape significantly between the 1995 and 1999 elections.
Boundaries edit
The riding was created in 1963 through an amendment to the Representation Act. It was formed from the south central part of the former riding of York—Scarborough, formed in 1955, the year following the erection of Metropolitan Toronto, departing from York East, where it had been part of since 1867, and represented in the past by such Scarborough Township residents as:
- John Richardson, (1894-1904),
- Alexander McCowan, (1905-1913),
- John A. Leslie, (1945-1948), and
- Hollis Beckett; (1951-1967) the latter remained with the York East riding.
With the rapid growth of Scarborough Township in the decade following the erection of Metropolitan Toronto, York—Scarborough, unlike its federal counterpart that remained into the 1970s, was split into four separate ridings in 1963; and MPP Dick Sutton did not seek re-election into any of the new ridings. The initial Scarborough Centre riding was bordered by: Lawrence Avenue to the north, Kennedy Road to the west, Lake Ontario to the south and Markham Road to the east.[1]
In 1975, the boundary was significantly altered. The northern boundary of Lawrence Avenue and the southern boundary of Lake Ontario were retained. The western boundary was redrawn as follows: from Lawrence Avenue, it followed the CNR right-of-way located west of Midland Avenue south and then curved southeast to where it met Midland Avenue at Danforth Road. It followed Midland Avenue south to Kingston Road where it turned southwest following Kingston to a point where a northerly extension of Wynnview Court would meet the road. It then turned south along Wynnview Court and continued on the same line south until it met the lake. The eastern boundary started at Lawrence Avenue and went south on Scarborough Golf Club Road following this road to the CNR right-of-way. It followed the tracks west to Markham Road and then south to the lake.[2]
In 1987 the boundary was altered again. The northern boundary of Lawrence Avenue and the southern boundary of Lake Ontario were retained. The eastern boundary starting at the lake went north along Kennedy Road to Eglinton Avenue. It then turned east for a short distance to the CPR right-of-way. It followed the right-of-way north to Lawrence Avenue. The eastern border was moved to Markham Road going from the lake to Lawrence Avenue.[3]
In 1995, the riding was radically changed with a union with the Scarborough-Ellesmere riding, and in 2007, with the creation of the Scarborough-Guildwood riding, and the northwest corner transferred from Scarborough-Agincourt. For the first time, the Scarborough Centre was now in the riding.
Members of Provincial Parliament edit
| Scarborough Centre | ||||
|---|---|---|---|---|
| Assembly | Years | Member | Party | |
| Riding created from York—Scarborough | ||||
| 27th | 1963–1967 | George Peck | Progressive Conservative | |
| 28th | 1967–1971 | Margaret Renwick | New Democratic | |
| 29th | 1971–1975 | Frank Drea | Progressive Conservative | |
| 30th | 1975–1977 | |||
| 31st | 1977–1981 | |||
| 32nd | 1981–1985 | |||
| 33rd | 1985–1987 | William C. Davis | ||
| 34th | 1987–1990 | Cindy Nicholas | Liberal | |
| 35th | 1990–1995 | Steve Owens | New Democratic | |
| 36th | 1995–1999 | Dan Newman | Progressive Conservative | |
| 37th | 1999–2003 | Marilyn Mushinski | ||
| 38th | 2003–2007 | Brad Duguid | Liberal | |
| 39th | 2007–2011 | |||
| 40th | 2011–2014 | |||
| 41st | 2014–2018 | |||
| 42nd | 2018–2022 | Christina Mitas | Progressive Conservative | |
| 43rd | 2022–present | David Smith | ||
| Sourced from the Ontario Legislative Assembly[4] | ||||
Election results edit
| 2022 Ontario general election | ||||||||
|---|---|---|---|---|---|---|---|---|
| Party | Candidate | Votes | % | ±% | Expenditures | |||
| Progressive Conservative | David Smith | 11,471 | 35.99 | −2.46 | $20,592 | |||
| Liberal | Mazhar Shafiq | 9,678 | 30.37 | +8.23 | $96,601 | |||
| New Democratic | Neethan Shan | 8,358 | 26.23 | −7.14 | $59,477 | |||
| Green | Fatima Faruq | 892 | 2.80 | +0.48 | $381 | |||
| Libertarian | Serge Korovitsyn | 392 | 1.23 | −1.39 | $84 | |||
| New Blue | Hidie Jaber | 355 | 1.11 | $1,292 | ||||
| Ontario Party | Raphael Rosch | 297 | 0.93 | $887 | ||||
| Independent | Kostadinos Stefanis | 196 | 0.62 | $0 | ||||
| Independent | Paul Beatty | 156 | 0.49 | $579 | ||||
| Moderate | Maria Tzvetanova | 74 | 0.23 | $0 | ||||
| Total valid votes/Expense limit | 31,869 | 99.22 | +0.33 | $109,001 | ||||
| Total rejected, unmarked, and declined ballots | 251 | 0.78 | −0.33 | |||||
| Turnout | 32,120 | 41.25 | −11.94 | |||||
| Eligible voters | 77,114 | |||||||
| Progressive Conservative hold | Swing | −5.34 | ||||||
Source(s)
| ||||||||
| 2018 Ontario general election | ||||||||
|---|---|---|---|---|---|---|---|---|
| Party | Candidate | Votes | % | ±% | ||||
| Progressive Conservative | Christina Mitas | 15,266 | 38.45 | +17.46 | ||||
| New Democratic | Zeyd Bismilla | 13,247 | 33.36 | +12.75 | ||||
| Liberal | Mazhar Shafiq | 8,791 | 22.14 | -33.05 | ||||
| Libertarian | Matt Dougherty | 1,040 | 2.62 | |||||
| Green | Sanjin Zeco | 919 | 2.31 | -0.78 | ||||
| Trillium | Chris Mellor | 441 | 1.11 | |||||
| Total valid votes | 39,704 | 98.89 | ||||||
| Total rejected, unmarked and declined ballots | 447 | 1.11 | ||||||
| Turnout | 40,151 | 53.19 | ||||||
| Eligible voters | 75,493 | |||||||
| Progressive Conservative gain from Liberal | Swing | +25.25 | ||||||
| Source: Elections Ontario[5] | ||||||||
| 2014 general election redistributed results[6] | |||
|---|---|---|---|
| Party | Vote | % | |
| Liberal | 18,648 | 55.19 | |
| Progressive Conservative | 7,093 | 20.99 | |
| New Democratic | 6,967 | 20.62 | |
| Green | 1,046 | 3.10 | |
| Others | 35 | 0.10 | |

| 2014 Ontario general election | ||||||||
|---|---|---|---|---|---|---|---|---|
| Party | Candidate | Votes | % | ±% | ||||
| Liberal | Brad Duguid | 19,251 | 54.94 | +3.81 | ||||
| Progressive Conservative | David Ramalho | 7,566 | 21.59 | -2.20 | ||||
| New Democratic | Carol Baker | 7,135 | 20.36 | -1.65 | ||||
| Green | Edward Yaghledjian | 1,086 | 3.10 | +1.33 | ||||
| Total valid votes | 35,038 | 100.0 | ||||||
| Liberal hold | Swing | +3.00 | ||||||
| Source: Elections Ontario[7] | ||||||||
| 2011 Ontario general election | ||||||||
|---|---|---|---|---|---|---|---|---|
| Party | Candidate | Votes | % | ±% | ||||
| Liberal | Brad Duguid | 16,142 | 51.13 | -2.44 | ||||
| Progressive Conservative | Carol Williams | 7,511 | 23.79 | -1.36 | ||||
| New Democratic | Kathleen Mathurin | 6,876 | 22.01 | +8.7 | ||||
| Green | Jeff Mole | 558 | 1.77 | -3.76 | ||||
| Freedom | David Driver | 301 | 0.95 | |||||
| Total valid votes | 31,568 | 100.00 | ||||||
| Total rejected, unmarked and declined ballots | 180 | 0.57 | ||||||
| Turnout | 31,568 | 44.49 | ||||||
| Eligible voters | 70,958 | |||||||
| Liberal hold | Swing | -0.54 | ||||||
| Source: Elections Ontario[8] | ||||||||
| 2007 Ontario general election | ||||||||
|---|---|---|---|---|---|---|---|---|
| Party | Candidate | Votes | % | ±% | ||||
| Liberal | Brad Duguid | 17,714 | 53.57 | +1.5 | ||||
| Progressive Conservative | Sammy Appadurai | 8,316 | 25.15 | -2.89 | ||||
| New Democratic | Kathleen Mathurin | 4,401 | 13.31 | +4.54 | ||||
| Green | Andrew Strachan | 1,827 | 5.53 | +3.99 | ||||
| Family Coalition | Thomas Lang | 459 | 1.39 | +0.2 | ||||
| Libertarian | David Predovich | 349 | 1.06 | |||||
| Total valid votes | 33,066 | 100.0 | ||||||

| 2003 Ontario general election | ||||||||
|---|---|---|---|---|---|---|---|---|
| Party | Candidate | Votes | % | ±% | ||||
| Liberal | Brad Duguid | 21,698 | 52.07 | +17.54 | ||||
| Progressive Conservative | Marilyn Mushinski | 11,686 | 28.04 | -15.08 | ||||
| New Democratic | Michael Laxer | 3,653 | 8.77 | -11.14 | ||||
| Independent | Costas Manios | 3,259 | 7.82 | |||||
| Green | Robert Carty | 642 | 1.54 | |||||
| Family Coalition | Joseph Internicola | 495 | 1.19 | -0.17 | ||||
| Communist | Elizabeth Rowley | 241 | 0.58 | |||||
| Total valid votes | 41,674 | 100.00 | ||||||
| 1999 Ontario general election | ||||||||
|---|---|---|---|---|---|---|---|---|
| Party | Candidate | Votes | % | ±% | ||||
| Progressive Conservative | Marilyn Mushinski | 18,189 | 43.12 | -2.75 | ||||
| Liberal | Costas Manios | 14,565 | 34.53 | +8.69 | ||||
| New Democratic | Sid Ryan | 8,399 | 19.91 | -4.76 | ||||
| Family Coalition | Rina Morra | 573 | 1.36 | |||||
| Natural Law | Eileen Murray | 455 | 1.08 | -0.17 | ||||
| Total valid votes | 42,181 | 100.00 | ||||||
2007 electoral reform referendum edit
| 2007 Ontario electoral reform referendum | |||
|---|---|---|---|
| Side | Votes | % | |
| First Past the Post | 19,259 | 61.7 | |
| Mixed member proportional | 12,444 | 38.3 | |
| Total valid votes | 31,701 | 100.0 | |
Historic election results edit
| 1995 Ontario general election | ||||||||
|---|---|---|---|---|---|---|---|---|
| Party | Candidate | Votes | % | ±% | ||||
| Progressive Conservative | Dan Newman | 12,717 | 45.87 | +25.72 | ||||
| Liberal | Mary Ellen Pimblett | 7,163 | 25.84 | -6.75 | ||||
| New Democratic | Steve Owens | 6,841 | 24.67 | -22.59 | ||||
| Independent | John Brereton | 649 | 2.34 | |||||
| Natural Law | Eleanor Hyodo | 349 | 1.25 | |||||
| Total valid votes | 28,079 | 100.0 | ||||||
| Source: Elections Ontario[9] | ||||||||
| 1990 Ontario general election | ||||||||
|---|---|---|---|---|---|---|---|---|
| Party | Candidate | Votes | % | ±% | ||||
| New Democratic | Steve Owens | 13,401 | 47.26 | +18.16 | ||||
| Liberal | Cindy Nicholas | 9,239 | 32.59 | -8.08 | ||||
| Progressive Conservative | Joe Trontadus | 5,713 | 20.15 | -4.47 | ||||
| Total valid votes | 28,353 | 100.0 | ||||||
| Source: Toronto Star[10] | ||||||||
| 1987 Ontario general election | ||||||||
|---|---|---|---|---|---|---|---|---|
| Party | Candidate | Votes | % | ±% | ||||
| Liberal | Cindy Nicholas | 11,930 | 40.67 | +6.58 | ||||
| New Democratic | Meano Vorster | 8,535 | 29.10 | -1.2 | ||||
| Progressive Conservative | Bill Davis | 7,222 | 24.62 | -11 | ||||
| Family Coalition | Chris Douros | 1,096 | 3.74 | |||||
| Independent | Martin Weatherall | 549 | 1.87 | |||||
| Total valid votes | 29,332 | 100.0 | ||||||
| Source: The Toronto Daily Star[11] | ||||||||
| 1985 Ontario general election | ||||||||
|---|---|---|---|---|---|---|---|---|
| Party | Candidate | Votes | % | ±% | ||||
| Progressive Conservative | Bill Davis | 8,921 | 35.62 | -20.49 | ||||
| Liberal | Gerrard Lennon | 8,537 | 34.09 | +13.75 | ||||
| New Democratic | Barry Christensen | 7,588 | 30.30 | +9.08 | ||||
| Total valid votes | 25,046 | 100.0 | ||||||
| Source: Canadian Press[12] | ||||||||
| 1981 Ontario general election | ||||||||
|---|---|---|---|---|---|---|---|---|
| Party | Candidate | Votes | % | ±% | ||||
| Progressive Conservative | Frank Drea | 12,793 | 56.11 | +12.52 | ||||
| New Democratic | Paul Rook | 4,837 | 21.22 | -11.92 | ||||
| Liberal | Kurt Christensen | 4,637 | 20.34 | +0.54 | ||||
| Libertarian | D'arcy Cain | 531 | 2.33 | -0.39 | ||||
| Total valid votes | 22,798 | 100.0 | ||||||
| Source: Canadian Press[13] | ||||||||
| 1977 Ontario general election | ||||||||
|---|---|---|---|---|---|---|---|---|
| Party | Candidate | Votes | % | ±% | ||||
| Progressive Conservative | Frank Drea | 11,585 | 43.59 | -4.93 | ||||
| New Democratic | Dave Gracey | 8,806 | 33.14 | +6.86 | ||||
| Liberal | Charles Beer | 5,263 | 19.80 | -4 | ||||
| Libertarian | Robert Schultz | 722 | 2.72 | |||||
| Communist | Peter Sideris | 200 | 0.75 | -0.19 | ||||
| Total valid votes | 26,576 | 100.0 | ||||||
| Source: Canadian Press[14] | ||||||||
| 1975 Ontario general election | ||||||||
|---|---|---|---|---|---|---|---|---|
| Party | Candidate | Votes | % | ±% | ||||
| Progressive Conservative | Frank Drea | 10,329 | 48.52 | +0.04 | ||||
| New Democratic | Dave Gracey | 5,595 | 26.28 | -6.94 | ||||
| Liberal | Ross Doswell | 5,067 | 23.80 | +8.56 | ||||
| Communist | Gareth Blythe | 200 | 0.94 | |||||
| Independent | R. M. Whidden | 96 | 0.45 | |||||
| Total valid votes | 21,287 | 100.0 | ||||||
| Source: Canadian Press[15] | ||||||||
| 1971 Ontario general election | ||||||||
|---|---|---|---|---|---|---|---|---|
| Party | Candidate | Votes | % | ±% | ||||
| Progressive Conservative | Frank Drea | 15,565 | 48.48 | +9.2 | ||||
| New Democratic | Margaret Renwick | 10,665 | 33.22 | -9.72 | ||||
| Liberal | Brian Wallace | 4,894 | 15.24 | -2.54 | ||||
| Independent | Syd Brown | 982 | 3.06 | |||||
| Total valid votes | 32,106 | 100.0 | ||||||
| Source: Canadian Press[16] | ||||||||
| 1967 Ontario general election | ||||||||
|---|---|---|---|---|---|---|---|---|
| Party | Candidate | Votes | % | ±% | ||||
| New Democratic | Margaret Renwick | 10,530 | 42.94 | +7.63 | ||||
| Progressive Conservative | George Peck | 9,632 | 39.28 | +1.91 | ||||
| Liberal | Conrad Stewart | 4,361 | 17.78 | -9.55 | ||||
| Total valid votes | 24,523 | 100.0 | ||||||
| Source: The Windsor Star[17] | ||||||||
| 1963 Ontario general election | ||||||||
|---|---|---|---|---|---|---|---|---|
| Party | Candidate | Votes | % | |||||
| Progressive Conservative | George Peck | 7,259 | 37.37 | |||||
| New Democratic | E. K. Ranney | 6,859 | 35.31 | |||||
| Liberal | A. M. Campbell | 5,309 | 27.33 | |||||
| Total valid votes | 19,427 | 100.0 | ||||||
| Source: Canadian Press[18] | ||||||||
References edit
- ^ Redistribution of Districts with statistics from the records 1867-1982 (Electoral History of Ontario). Office of the Chief Election Officer. 1984.
- ^ Howard, Ross (September 13, 1975). "Scarborough Centre unruffled by quiet campaign". Toronto Star. p. A7.
- ^ James, Royson (August 25, 1987). "Former Tory stronghold now wide open". Toronto Star. p. A7.
- ^ For a listing of each MPP's Queen's Park curriculum vitae see below:
- For George Peck's Legislative Assembly information see "George Henry Peck, MPP". Parliamentary History. Toronto: Legislative Assembly of Ontario. 2014. Retrieved 2014-09-08.
- For Margaret Renwick's Legislative Assembly information see "Margaret Renwick, MPP". Parliamentary History. Toronto: Legislative Assembly of Ontario. 2014. Retrieved 2014-09-08.
- For Frank Drea's Legislative Assembly information see "James Francis Drea, MPP". Parliamentary History. Toronto: Legislative Assembly of Ontario. 2014. Retrieved 2014-09-08.
- For William Davis's Legislative Assembly information see "William C. Davis, MPP". Parliamentary History. Toronto: Legislative Assembly of Ontario. 2014. Retrieved 2014-09-08.
- For Cindy Nicholas's Legislative Assembly information see "Cynthia Marie Nicholas, MPP". Parliamentary History. Toronto: Legislative Assembly of Ontario. 2014. Retrieved 2014-09-08.
- For Steve Owens' Legislative Assembly information see "Stephen Owens, MPP". Parliamentary History. Toronto: Legislative Assembly of Ontario. 2014. Retrieved 2014-09-08.
- For Dan Newman's Legislative Assembly information see "Dan Newman, MPP". Parliamentary History. Toronto: Legislative Assembly of Ontario. 2014. Retrieved 2014-09-08.
- For Marilyn Mushinski's Legislative Assembly information see "Marilyn Mushinski, MPP". Parliamentary History. Toronto: Legislative Assembly of Ontario. 2014. Retrieved 2014-09-08.
- For Brad Duguid's Legislative Assembly information see "Brad Duguid, MPP". Parliamentary History. Toronto: Legislative Assembly of Ontario. 2014. Retrieved 2014-09-08.
- ^ "Summary of Valid Votes Cast for each Candidate" (PDF). Elections Ontario. p. 10. Retrieved 20 January 2019.
- ^ "94 - Scarborough Centre".
- ^ "General Election Results by District, 081 Scarborough Centre". Elections Ontario. 2014. Archived from the original on 17 June 2014. Retrieved 17 June 2014.
- ^ "Official return from the records - Rapport des registres officiels - Scarborough Centre" (PDF). Elections Ontario. 2011. Retrieved 6 June 2014.
- ^ "Summary of Valid Ballots by Candidate". Elections Ontario. 1995-06-08. Retrieved 2012-09-04.
- ^ "How Metro-Area Voted". The Toronto Daily Star. Toronto. 1990-09-07. p. A10.
- ^ "How Metro-Area Voted". The Toronto Daily Star. Toronto. 1987-09-11. p. A12.
- ^ Canadian Press (1985-05-03). "The night the Tories tumbled; riding by riding results". Ottawa Citizen. Toronto. p. 43. Retrieved 2012-05-10.
- ^ Canadian Press (1981-03-20). "Election results for Metro Toronto ridings". The Windsor Star. Windsor, Ontario. p. 22. Retrieved 2012-08-24.
- ^ Canadian Press (1977-06-10). "How they voted in Metro area". The Toronto Daily Star. Toronto. p. A10.
- ^ Canadian Press (1975-09-19). "Results from the 29 ridings in Metro". The Toronto Daily Star. Toronto. p. A18.
- ^ Canadian Press (1971-10-22). "Here's who won on the Metro ridings". The Toronto Daily Star. Toronto. p. 12.
- ^ Canadian Press (1967-10-18). "Tories win, but..." The Windsor Star. Windsor, Ontario. p. B2. Retrieved 2012-04-30.
- ^ Canadian Press (1963-09-26). "78 in Tory Blue Wave -- 23 Is All Grits Saved". The Windsor Star. Windsor, Ontario. p. 25. Retrieved 2012-04-24.
External links edit
- Elections Ontario Past Election Results
- Map of riding for 2018 election