


Summary
Gravesham (/ˈɡreɪvʃəm/) is a constituency in Kent represented in the House of Commons of the UK Parliament since 2005 by Adam Holloway, a Conservative.
| Gravesham | |
|---|---|
| County constituency for the House of Commons | |
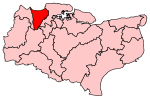 Boundary of Gravesham in Kent for the 2010 general election | |
 Location of Kent within England | |
| County | Kent |
| Electorate | 72,868 (June 2021)[1] |
| Major settlements | Gravesend |
| Current constituency | |
| Created | 1983 |
| Member of Parliament | Adam Holloway (Conservative) |
| Seats | One |
| Created from | Gravesend |
Constituency profile edit
The seat covers the historic riverside town of Gravesend and a more rural area extending to Higham and Vigo Village on the North Downs. The electorate voted strongly to leave in the 2016 EU referendum. Health and wealth are roughly average for the UK.[2]
Boundaries edit

Since the constituency's creation, its boundaries have been co-terminous with those of the Borough of Gravesham. The largest town in the constituency is Gravesend.
Proposed edit
Further to the 2023 Periodic Review of Westminster constituencies, enacted by the Parliamentary Constituencies Order 2023, the composition of the constituency from the next general election, due by January 2025, will be unchanged.[3]
History edit
This particular name of the seat was created in 1983 effectively as the new name for the Gravesend seat.
The constituency and its predecessor together was considered a bellwether seat: from World War I until 2005 with the exceptions of the General Elections in 1929 Election and 1951, its winner came from the winning party.[n 1] In 2005 Adam Holloway was one of 36 Conservative candidates to gain a seat from other parties, and has held the seat since then. Since the 2005 result conflicted with the UK outcome, the seat is regarded as having lost its bellwether status.[4]
Members of Parliament edit
| Election | Member[5] | Party | |
|---|---|---|---|
| 1983 | Tim Brinton | Conservative | |
| 1987 | Jacques Arnold | Conservative | |
| 1997 | Chris Pond | Labour | |
| 2005 | Adam Holloway | Conservative | |
Elections edit
Elections in the 2020s edit
| Party | Candidate | Votes | % | ±% | |
|---|---|---|---|---|---|
| Labour | Lauren Sullivan[6] | ||||
| Liberal Democrats | Ukonu Obasi[7] | ||||
| Reform UK | Matthew Fraser Moat[8] | ||||
| Majority | |||||
| Turnout | |||||
Elections in the 2010s edit
| Party | Candidate | Votes | % | ±% | |
|---|---|---|---|---|---|
| Conservative | Adam Holloway | 29,580 | 62.2 | +6.6 | |
| Labour | Lauren Sullivan | 13,999 | 29.4 | -7.1 | |
| Liberal Democrats | Ukonu Obasi | 2,584 | 5.4 | +2.9 | |
| Green | Marna Gilligan | 1,397 | 2.9 | +1.4 | |
| Majority | 15,581 | 32.8 | +13.7 | ||
| Turnout | 47,560 | 64.9 | -2.3 | ||
| Conservative hold | Swing | +6.8 | |||
| Party | Candidate | Votes | % | ±% | |
|---|---|---|---|---|---|
| Conservative | Adam Holloway | 27,237 | 55.6 | +8.8 | |
| Labour | Mandy Garford | 17,890 | 36.5 | +6.4 | |
| UKIP | Emmanuel Feyisetan | 1,742 | 3.6 | -15.0 | |
| Liberal Democrats | James Willis | 1,210 | 2.5 | +0.3 | |
| Green | Marna Gilligan | 723 | 1.5 | -0.8 | |
| Independent | Michael Rogan | 195 | 0.4 | New | |
| Majority | 9,347 | 19.1 | +2.4 | ||
| Turnout | 49,106 | 67.2 | -0.3 | ||
| Conservative hold | Swing | +1.2 | |||
| Party | Candidate | Votes | % | ±% | |
|---|---|---|---|---|---|
| Conservative | Adam Holloway | 23,484 | 46.8 | −1.7 | |
| Labour | Tanmanjeet Singh Dhesi[11] | 15,114 | 30.1 | +1.3 | |
| UKIP | Sean Marriott | 9,306 | 18.6 | +13.8 | |
| Green | Mark Lindop | 1,124 | 2.2 | +0.8 | |
| Liberal Democrats | Anne-Marie Bunting | 1,111 | 2.2 | −11.1 | |
| Majority | 8,370 | 16.7 | -3.0 | ||
| Turnout | 50,139 | 67.5 | +0.1 | ||
| Conservative hold | Swing | −1.5 | |||
| Party | Candidate | Votes | % | ±% | |
|---|---|---|---|---|---|
| Conservative | Adam Holloway | 22,956 | 48.5 | +4.8 | |
| Labour Co-op | Kathryn Smith | 13,644 | 28.8 | −13.4 | |
| Liberal Democrats | Anna Arrowsmith | 6,293 | 13.3 | +2.6 | |
| UKIP | Geoffrey Clark | 2,265 | 4.8 | +2.9 | |
| English Democrat | Steve Uncles | 1,005 | 2.1 | New | |
| Green | Richard Crawford | 675 | 1.4 | New | |
| Independent | Alice Dartnell | 465 | 1.0 | New | |
| Majority | 9,312 | 19.7 | +18.2 | ||
| Turnout | 47,303 | 67.4 | +1.6 | ||
| Conservative hold | Swing | +9.1 | |||
Elections in the 2000s edit
| Party | Candidate | Votes | % | ±% | |
|---|---|---|---|---|---|
| Conservative | Adam Holloway | 19,739 | 43.7 | +4.9 | |
| Labour | Chris Pond | 19,085 | 42.2 | −7.7 | |
| Liberal Democrats | Bruce Parmenter | 4,851 | 10.7 | +1.5 | |
| UKIP | Geoff Coates | 850 | 1.9 | −0.2 | |
| English Independence Party | Christopher Nickerson | 654 | 1.4 | New | |
| Majority | 654 | 1.5 | N/A | ||
| Turnout | 45,179 | 65.8 | +3.1 | ||
| Conservative gain from Labour | Swing | +6.3 | |||
| Party | Candidate | Votes | % | ±% | |
|---|---|---|---|---|---|
| Labour | Chris Pond | 21,773 | 49.9 | +0.2 | |
| Conservative | Jacques Arnold | 16,911 | 38.8 | 0.0 | |
| Liberal Democrats | Bruce Parmenter | 4,031 | 9.2 | +1.5 | |
| UKIP | William Jenner | 924 | 2.1 | New | |
| Majority | 4,862 | 11.1 | +0.3 | ||
| Turnout | 43,639 | 62.7 | −14.2 | ||
| Labour hold | Swing | +0.1 | |||
Elections in the 1990s edit
| Party | Candidate | Votes | % | ±% | |
|---|---|---|---|---|---|
| Labour | Chris Pond | 26,460 | 49.7 | +9.3 | |
| Conservative | Jacques Arnold | 20,681 | 38.8 | -10.9 | |
| Liberal Democrats | Merilyn Canet | 4,128 | 7.8 | -1.1 | |
| Referendum | Patricia Curtis | 1,441 | 2.7 | New | |
| Independent Labour | Anthony Leyshon | 414 | 0.8 | New | |
| Natural Law | David Palmer | 129 | 0.2 | New | |
| Majority | 5,779 | 10.9 | N/A | ||
| Turnout | 53,253 | 76.9 | -6.5 | ||
| Labour gain from Conservative | Swing | -10.1 | |||
| Party | Candidate | Votes | % | ±% | |
|---|---|---|---|---|---|
| Conservative | Jacques Arnold | 29,322 | 49.7 | −0.4 | |
| Labour | Graham A. Green | 23,829 | 40.4 | +5.6 | |
| Liberal Democrats | Derek R. Deedman | 5,269 | 8.9 | −6.2 | |
| Independent | AJ Bunstone | 273 | 0.5 | New | |
| Ind. Conservative | REB Khilkoff-Boulding | 187 | 0.3 | New | |
| Independent Socialist | BJ Buxton | 174 | 0.3 | New | |
| Majority | 5,493 | 9.3 | −6.0 | ||
| Turnout | 59,054 | 83.4 | +4.1 | ||
| Conservative hold | Swing | −3.0 | |||
Elections in the 1980s edit
| Party | Candidate | Votes | % | ±% | |
|---|---|---|---|---|---|
| Conservative | Jacques Arnold | 28,891 | 50.1 | +2.7 | |
| Labour | Martin Coleman | 20,099 | 34.8 | +2.9 | |
| Liberal (Alliance) | Robert Crawford | 8,724 | 15.1 | -4.6 | |
| Majority | 8,792 | 15.3 | -0.2 | ||
| Turnout | 57,714 | 79.3 | +2.2 | ||
| Conservative hold | Swing | -0.1 | |||
| Party | Candidate | Votes | % | ±% | |
|---|---|---|---|---|---|
| Conservative | Tim Brinton | 25,968 | 47.4 | ||
| Labour | John Ovenden | 17,505 | 31.9 | ||
| SDP (Alliance) | M Horton | 10,826 | 19.7 | ||
| National Front | P Johnson | 420 | 0.8 | ||
| Ecology | Martin Sewell | 103 | 0.2 | ||
| Majority | 8,463 | 15.5 | |||
| Turnout | 54,822 | 77.1 | |||
| Conservative win (new seat) | |||||
See also edit
Notes edit
- ^ Nonetheless, in the 1929 and 1951 elections, the seat elected into office the candidate from the party with the largest national share of the vote
References edit
- ^ "Electorate Figures - Boundary Commission for England". 2021 Electorate Figures. Boundary Commission for England. June 2021. Archived (PDF) from the original on 8 June 2021. Retrieved 15 July 2021.
- ^ Electoral Calculus https://www.electoralcalculus.co.uk/fcgi-bin/seatdetails.py?seat=Gravesham
- ^ "The Parliamentary Constituencies Order 2023". Schedule 1 Part 6 South East region.
- ^ Jones, Ian. "Is the bell about to toll for bellwether seats?". May 2015 Election. New Statesman. Retrieved 14 April 2015.
- ^ "Timothy Brinton former MP, Grsvesham". TheyWorkForYou.com. mySociety. Retrieved 27 August 2015.
- ^ "Labour selections: parliamentary candidates selected so far for the general election". LabourList. Retrieved 13 February 2024.
- ^ "Liberal Democrat Prospective Parliamentary Candidates". Mark Pack. Retrieved 13 February 2024.
- ^ "Gravesham Constituency". Reform UK. Retrieved 13 February 2024.
- ^ "Archived copy" (PDF). Archived from the original (PDF) on 17 November 2019. Retrieved 17 November 2019.
{{cite web}}: CS1 maint: archived copy as title (link) - ^ "Election Data 2015". Electoral Calculus. Archived from the original on 17 October 2015. Retrieved 17 October 2015.
- ^ "GRAVESHAM 2015". electionresults.blogspot.co.uk.
- ^ "Election Data 2010". Electoral Calculus. Archived from the original on 26 July 2013. Retrieved 17 October 2015.
- ^ "Election Data 2005". Electoral Calculus. Archived from the original on 15 October 2011. Retrieved 18 October 2015.
- ^ "Election Data 2001". Electoral Calculus. Archived from the original on 15 October 2011. Retrieved 18 October 2015.
- ^ "Election Data 1997". Electoral Calculus. Archived from the original on 15 October 2011. Retrieved 18 October 2015.
- ^ "Election Data 1992". Electoral Calculus. Archived from the original on 15 October 2011. Retrieved 18 October 2015.
- ^ "Politics Resources". Election 1992. Politics Resources. 9 April 1992. Archived from the original on 24 July 2011. Retrieved 6 December 2010.
- ^ "Election Data 1987". Electoral Calculus. Archived from the original on 15 October 2011. Retrieved 18 October 2015.
- ^ "Election Data 1983". Electoral Calculus. Archived from the original on 15 October 2011. Retrieved 18 October 2015.
51°24′N 0°22′E / 51.400°N 0.367°E