


Summary
The 2022 United States House of Representatives elections in West Virginia were held on November 8, 2022, to elect the two U.S. representatives from the State of West Virginia, one from each of the state's two congressional districts. The elections coincided with other elections to the House of Representatives, elections to the United States Senate, and various state and local elections.
| |||||||||||||||||||||||||
Both West Virginia seats to the United States House of Representatives | |||||||||||||||||||||||||
|---|---|---|---|---|---|---|---|---|---|---|---|---|---|---|---|---|---|---|---|---|---|---|---|---|---|
| |||||||||||||||||||||||||
 
| |||||||||||||||||||||||||
District boundaries were redrawn to ensure that the districts are apportioned based on data from the 2020 census, which got rid of a congressional district in West Virginia's delegation.
Overview edit
| District | Republican | Democratic | Independent | Total | Result | ||||
|---|---|---|---|---|---|---|---|---|---|
| Votes | % | Votes | % | Votes | % | ||||
| District 1 | 151,511 | 66.69% | 65,428 | 28.80% | 10,257 | 4.51% | 227,196 | 100.0% | Republican hold |
| District 2 | 160,493 | 65.57% | 84,278 | 34.43% | 0 | 0% | 244,771 | 100.0% | Republican hold |
| Total | 312,004 | 66.11% | 149,706 | 31.72% | 10,257 | 2.17% | 471,967 | 100.0% | |

District 1 edit
| |||||||||||||||||
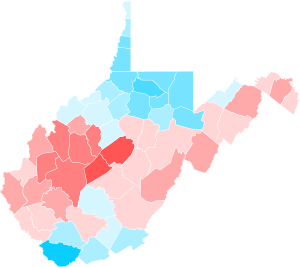
  County & precinct results Miller: 40–50% 50–60% 60–70% 70–80% 80–90% >90% Watson: 40–50% 50–60% 60–70% 70–80% 80–90% >90% Tie: 40–50% No data | |||||||||||||||||
| |||||||||||||||||


The 1st district encompasses Southern West Virginia, taking in Huntington, Charleston, Bluefield, Princeton and Beckley. The incumbent was Republican Carol Miller, who was re-elected in the 3rd district with 71.3% of the vote in 2020.[1]
Republican primary edit
Candidates edit
Nominee edit
- Carol Miller, incumbent U.S. Representative (2019–present)[2][3]
Eliminated in primary edit
- Scott Fuller[3]
- James Houser[3]
- Zane Lawhorn, candidate for state delegate in 2018 and Libertarian nominee for the 3rd district in 2016[3]
- Kent Stevens, businessman[3]
Endorsements edit
- Organizations
Results edit
| Party | Candidate | Votes | % | |
|---|---|---|---|---|
| Republican | Carol Miller (incumbent) | 41,852 | 66.3 | |
| Republican | Scott Fuller | 6,197 | 9.8 | |
| Republican | Zane Lawhorn | 5,530 | 8.8 | |
| Republican | James Houser | 4,877 | 7.7 | |
| Republican | Kent Stevens | 4,658 | 7.4 | |
| Total votes | 63,114 | 100.0 | ||
Democratic primary edit
Candidates edit
Nominee edit
- Lacy Watson, candidate for West Virginia's 3rd congressional district in 2020[3]
Results edit
| Party | Candidate | Votes | % | |
|---|---|---|---|---|
| Democratic | Lacy Watson | 32,686 | 100.0 | |
| Total votes | 32,686 | 100.0 | ||
General election edit
Predictions edit
| Source | Ranking | As of |
|---|---|---|
| The Cook Political Report[6] | Solid R | February 8, 2022 |
| Inside Elections[7] | Solid R | February 11, 2022 |
| Sabato's Crystal Ball[8] | Safe R | February 8, 2022 |
| Politico[9] | Solid R | April 5, 2022 |
| RCP[10] | Safe R | June 9, 2022 |
| Fox News[11] | Solid R | July 11, 2022 |
| DDHQ[12] | Solid R | July 20, 2022 |
| 538[13] | Solid R | June 30, 2022 |
Results edit
| Party | Candidate | Votes | % | |
|---|---|---|---|---|
| Republican | Carol Miller (incumbent) | 151,511 | 66.7 | |
| Democratic | Lacy Watson | 65,428 | 28.8 | |
| Independent | Belinda Fox-Spencer | 10,257 | 4.5 | |
| Total votes | 227,196 | 100.0 | ||
| Republican hold | ||||
District 2 edit
| |||||||||||||||||
  County & precinct results Mooney: 50–60% 60–70% 70–80% 80–90% >90% Wendell: 50–60% 60–70% 70–80% 80–90% >90% Tie: 50% No data | |||||||||||||||||
| |||||||||||||||||
The 2nd district encompasses the industrial areas of the northern Panhandle including Wheeling, Fairmont, Clarksburg, Morgantown and Parkersburg, as well as the eastern Panhandle. The incumbents from the district's two predecessor districts are Republican David McKinley (who was re-elected in the 1st district with 69.0% of the vote in 2020) and Republican Alex Mooney (who was re-elected in the 2nd district with 63.1% of the vote in 2020).[1]
Republican primary edit
Candidates edit
Nominee edit
- Alex Mooney, incumbent U.S. Representative (2015–present)[2][3]
Eliminated in primary edit
- Susan Buchser-Lochocki, artist[3]
- Rhonda Hercules[3]
- David McKinley, incumbent U.S. Representative (2011–present)[2][3]
- Mike Seckman[3]
Withdrawn edit
Endorsements edit
- U.S. executive branch officials
- Donald Trump, 45th president of the United States (2017–2021)[17]
- U.S. Representatives
- Ronny Jackson, U.S. Representative for Texas's 13th congressional district (2021–present)[18]
- Organizations
- Executive branch officials
- Mike Pompeo, United States Secretary of State (2018–2021), Director of the CIA (2017–2018), U.S. Representative for Kansas's 4th congressional district (2011–2017)[22]
- U.S. Senators
- Joe Manchin, U.S. Senator from West Virginia (2010–present) and former governor of West Virginia (2005–2010) (Democrat)[23]
- Governors
- Jim Justice, Governor of West Virginia (2017–present)[24]
- State legislators
- Edwin Bowman, former mayor of Weirton (1987–1995) and former state senator (1995–2010) (Democrat)[25]
- Individuals
- Andrew Yang, entrepreneur, founder of Venture for America, Democratic candidate for President of the United States in 2020 and for Mayor of New York City in 2021 (Independent, Forward Party)[26]
- Organizations
- Citizens for Responsible Energy Solutions[27]
- Gas and Oil Association of West Virginia[28]
- West Virginia Business & Industry Council[29]
- West Virginia Chamber of Commerce[29]
- West Virginia Manufacturing Association[29]
- Newspapers
- The Intelligencer and Wheeling News Register[30]
- The Preston County News & Journal[31]
Polling edit
- Graphical summary
| Poll source | Date(s) administered |
Sample size[a] |
Margin of error |
David McKinley |
Alex Mooney |
Other | Undecided |
|---|---|---|---|---|---|---|---|
| Research America Inc. | April 27 – May 4, 2022 | 350 (LV) | ± 5.2% | 33% | 48% | 6%[b] | 13% |
| Public Opinion Strategies (R)[A] | April 26–28, 2022 | 400 (LV) | ± 4.9% | 30% | 50% | – | – |
| Public Opinion Strategies (R)[A] | April 3–5, 2022 | 400 (LV) | ± 4.9% | 31% | 42% | – | – |
| North Star Opinion Research (R)[B] | March 13–15, 2022 | 400 (LV) | ± 4.9% | 38% | 33% | 4% | 25% |
| 46% | 39% | – | 15% | ||||
| WPA Intelligence (R)[C] | February 2–3, 2022 | 406 (LV) | ± 4.9% | 28% | 43% | 2%[c] | 27% |
| Public Opinion Strategies (R)[A] | January 4–6, 2022 | 400 (LV) | ± 4.9% | 32% | 45% | 10% | 13% |
| Meeting Street Insights (R)[D] | December 13–15, 2021 | 400 (LV) | ± 4.9% | 40% | 34% | 5% | 21% |
| Public Opinion Strategies (R)[A] | November 2021 | 400 (LV) | ± 4.9% | 42% | 39% | – | 19% |
| National Research Inc. (R)[E] | October 23–26, 2021 | 400 (LV) | ± 4.9% | 44% | 29% | 9% | 18% |
Results edit

- 30–40%
- 40–50%
- 50–60%
- 60–70%
- 70–80%
- 40–50%
- 50–60%
- 60–70%
| Party | Candidate | Votes | % | |
|---|---|---|---|---|
| Republican | Alex Mooney (incumbent) | 45,164 | 54.2 | |
| Republican | David McKinley (incumbent) | 29,619 | 35.6 | |
| Republican | Susan Buchser-Lochocki | 3,329 | 4.0 | |
| Republican | Mike Seckman | 3,076 | 3.7 | |
| Republican | Rhonda Hercules | 2,083 | 2.5 | |
| Total votes | 83,271 | 100.0 | ||
Democratic primary edit
Candidates edit
Nominee edit
- Barry Lee Wendell, former Morgantown city councilor[32][3]
Eliminated in primary edit
- Angela Dwyer[3]
Results edit

- 50–60%
- 60–70%
- 70–80%
- 80–90%
- 50–60%
- 70–80%
- 80–90%
- >90%
| Party | Candidate | Votes | % | |
|---|---|---|---|---|
| Democratic | Barry Lee Wendell | 22,139 | 57.1 | |
| Democratic | Angela Dwyer | 16,653 | 42.9 | |
| Total votes | 38,792 | 100.0 | ||
General election edit
Predictions edit
| Source | Ranking | As of |
|---|---|---|
| The Cook Political Report[6] | Solid R | February 8, 2022 |
| Inside Elections[7] | Solid R | February 11, 2022 |
| Sabato's Crystal Ball[8] | Safe R | February 8, 2022 |
| Politico[9] | Solid R | April 5, 2022 |
| RCP[10] | Safe R | June 9, 2022 |
| Fox News[11] | Solid R | July 11, 2022 |
| DDHQ[12] | Solid R | July 20, 2022 |
| 538[13] | Solid R | June 30, 2022 |
Results edit
| Party | Candidate | Votes | % | |
|---|---|---|---|---|
| Republican | Alex Mooney (incumbent) | 160,493 | 65.6 | |
| Democratic | Barry Lee Wendell | 84,278 | 34.4 | |
| Total votes | 244,771 | 100.0 | ||
| Republican hold | ||||
Notes edit
- Partisan clients
- ^ a b c d Poll sponsored by Mooney's campaign
- ^ This poll was sponsored by the West Virginia Chamber of Commerce, which supports McKinley
- ^ This poll was sponsored by Club for Growth Action which endorsed Mooney's campaign prior to its sampling period
- ^ Poll sponsored by McKinley's campaign
- ^ This poll was sponsored by GOPAC
References edit
- ^ a b Johnson, Cheryl L. (February 28, 2019). "Statistics of the Congressional Election of November 3, 2020". Clerk of the U.S. House of Representatives.
- ^ a b c Mutnick, Ally (October 14, 2021). "Redistricting forces two GOP incumbents together in West Virginia". Politico.
- ^ a b c d e f g h i j k l m "2022 Candidate Listing By Office". Retrieved January 29, 2022.
- ^ "2022 Candidates". www.maggieslist.org. Retrieved January 2, 2021.
- ^ a b c d "May 10, 2022 Primary Election".
- ^ a b "2022 House Race Ratings". The Cook Political Report. Retrieved February 11, 2022.
- ^ a b "House Ratings". The Rothenberg Political Report. Retrieved February 11, 2022.
- ^ a b "2022 House Ratings". Sabato's Crystal Ball. November 11, 2021. Retrieved February 11, 2022.
- ^ a b "2022 Election Forecast". Politico. April 5, 2022.
- ^ a b "Battle for the House 2022". RCP. June 9, 2022.
- ^ a b "2022 Election Forecast". Fox News. July 11, 2022. Retrieved July 11, 2022.
- ^ a b "2022 Election Forecast". DDHQ. July 20, 2022. Retrieved July 20, 2022.
- ^ a b "2022 Election Forecast". FiveThirtyEight. June 30, 2022. Retrieved June 30, 2022.
- ^ a b "November 8, 2022 General Election".
- ^ Thomas, Shibu (June 4, 2021). "Christians Attempt To Cancel Pride, Celebrate June As 'Christianity Month'". Star Observer. Retrieved July 2, 2021.
- ^ Michael Sisco For Monarch [@MichaelSiscoWV] (January 31, 2022). "As the path forward to victory has become impractical at this time, the necessity to remove establishment hacks like @RepMcKinley from office remains. I am dropping out of the race and offer my full endorsement to @MooneyforWV. Full statement is on Gab. https://t.co/QzoYtAxsTM" (Tweet). Archived from the original on January 31, 2022. Retrieved February 21, 2022 – via Twitter.
- ^ Lynch, John (November 16, 2021). "West Virginia Congressman endorsed by Trump". WTRF-TV. Retrieved November 16, 2021.
- ^ a b Thomas, Alex. "Mooney touts conservative endorsements as primary approaches". West Virginia MetroNews. Retrieved April 22, 2022.
- ^ Adams, Steven (November 22, 2021). "Rep. David McKinley: 'No Qualms' Over Infrastructure Vote". The Intelligencer and Wheeling News Register. Retrieved November 23, 2021.
- ^ "FreedomWorks for America Endorses Alex Mooney for Re-Election in West Virginia". www.freedomworksforamerica.org. October 28, 2021. Retrieved January 10, 2022.
- ^ "WV-02: Stand With Alex Mooney". www.housefreedomfund.com. November 8, 2021. Retrieved January 28, 2022.
- ^ "Pompeo endorses 'old friend' McKinley". April 21, 2022.
- ^ Thomas, Alex. "Manchin endorses McKinley, denounces Mooney attack". wvmetronews.com. West Virginia MetroNews. Retrieved May 1, 2022.
- ^ Thomas, Alex. "Justice endorses McKinley in matchup against Mooney". West Virginia MetroNews. Retrieved February 17, 2022.
- ^ "McKinley Right Choice for W.Va". The Intelligencer and Wheeling News Register. April 30, 2022. Retrieved May 2, 2022.
- ^ Metzger, Bryan (November 22, 2021). "Andrew Yang endorsed Rep. David McKinley, a West Virginia Republican that Trump trashed for backing infrastructure bill". Business Insider. Retrieved November 23, 2021.
- ^ "Citizens for Responsible Energy Solutions Announces Second Round of Congressional Endorsements for the 2022 Election Cycle". cresenergy.com. Citizens for Responsible Energy Solutions. May 4, 2022. Archived from the original on August 21, 2022. Retrieved June 7, 2022.
- ^ "Gas and Oil Association of West Virginia Backing McKinley in Congressional Primary". The Intelligencer and Wheeling News Register. April 29, 2022. Retrieved May 2, 2022.
- ^ a b c "State-based organizations endorse McKinley in congressional race". West Virginia MetroNews. April 11, 2022. Retrieved April 27, 2022.
- ^ "McKinley the Right Choice for W.Va". The Intelligencer and Wheeling News Register. April 23, 2022. Retrieved May 2, 2022.
- ^ "McKinley clear choice in Republican congressional primary". Preston County News & Journal. April 26, 2022. Retrieved May 2, 2022.
- ^ Wilt, Jessica (February 3, 2022). "Wendell runs on Democratic ticket in 2nd Congressional District". The Journal. Retrieved February 4, 2022.
External links edit
- Official campaign websites for 1st district candidates
- Carol Miller (R) for Congress
- Lacy Watson (D) for Congress
- Official campaign websites for 2nd district candidates
- Alex Mooney (R) for Congress
- Barry Wendell (D) for Congress