


Summary
The Forest Landscape Integrity Index (FLII) is an annual global index of forest condition measured by degree of anthropogenic modification.[1][2][3][4][5] Created by a team of 48 scientists, the FLII, in its measurement of 300m pixels of forest across the globe, finds that ~17.4 million km2 of forest has high landscape-level integrity (with a score from 9.6–10), compared to ~14.6 million with medium integrity (6–9.6) and ~12.2 million km2 with low integrity (0–6).

The FLII finds that most remaining high-integrity forest landscapes are found in Canada, Russia, Rocky Mountains, Alaska, the Amazon, the Guianas, southern Chile, Central Africa, and New Guinea. Low integrity forests, on the other hand, are found in Western and Central Europe, the American Southeast, South-East Asia west of New Guinea, the Andes, much of China and India, the Albertine Rift, West Africa, Mesoamerica, and the Atlantic Forests of Brazil.
The results are meant to help decision-makers at all levels achieve their commitments to the Sustainable Development Goals (SDGs), United Nations Convention on Biological Diversity (CBD), Convention to Combat Desertification (UNCCD), and the Framework Convention on Climate Change (UNFCCC).[1]
Forest Integrity edit
An ecosystem is considered to have integrity when its structure, composition, and ecological processes are within their natural range.[6]
Country rankings edit
172 countries have been ranked: [7]
| Country | Mean FLII | Low integrity (km2) | Medium integrity (km2) | High integrity (km2) | Total forest area (km2) | Map |
|---|---|---|---|---|---|---|
| 10 | 0 | 0 | 68 | 68 |  | |
| 9.8 | 1 | 72 | 495 | 569 |  | |
| 9.58 | 4,162 | 40,817 | 147,413 | 192,391 |  | |
| 9.45 | 5,083 | 59,389 | 146,218 | 210,691 | ||
| 9.39 | 6,796 | 25,031 | 107,954 | 139,781 |  | |
| 9.36 | 520 | 11,915 | 27,407 | 39,841 |  | |
| 9.28 | 30,161 | 139,350 | 379,097 | 548,608 | ||
| 9.13 | 13 | 187 | 372 | 572 |  | |
| 9.07 | 11,780 | 118,348 | 120,852 | 250,979 |  | |
| 9.02 | 739,484 | 2,245,281 | 5,137,079 | 8,121,843 | 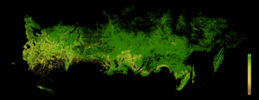 | |
| 8.99 | 480,206 | 1,027,386 | 2,968,268 | 4,475,860 |  | |
| 8.89 | 24,512 | 124,215 | 158,184 | 306,911 |  | |
| 8.86 | 329 | 2,819 | 2,761 | 5,909 |  | |
| 8.86 | 85,793 | 190,547 | 509,720 | 786,061 | 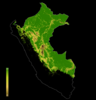 | |
| 8.85 | 90 | 1,475 | 977 | 2,542 |  | |
| 8.85 | 1,620 | 16,769 | 10,140 | 28,529 |  | |
| 8.84 | 37,294 | 183,415 | 216,355 | 437,064 |  | |
| 8.82 | 734 | 5,322 | 4,448 | 10,504 |  | |
| 8.78 | 64,650 | 170,792 | 351,112 | 586,554 | 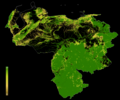 | |
| 8.65 | 34 | 137 | 130 | 301 |  | |
| 8.47 | 78,745 | 280,532 | 272,007 | 631,284 |  | |
| 8.43 | 5 | 13 | 17 | 36 |  | |
| 8.35 | 105,487 | 284,054 | 315,895 | 705,436 |  | |
| 8.35 | 1,753 | 10,802 | 3,594 | 16,148 | ||
| 8.26 | 150,737 | 272,442 | 428,320 | 851,499 | ||
| 8.23 | 6,068 | 18,926 | 15,294 | 40,288 |  | |
| 8.09 | 45 | 333 | 9 | 387 |  | |
| 8.02 | 8,374 | 40,156 | 8,410 | 56,939 |  | |
| 8 | 66,191 | 181,336 | 119,263 | 366,789 |  | |
| 7.99 | 3,982 | 17,595 | 5,007 | 26,585 |  | |
| 7.79 | 6,982 | 17,803 | 9,784 | 34,570 |  | |
| 7.71 | 1,102 | 2,842 | 1,498 | 5,442 |  | |
| 7.69 | 284 | 1,149 | 82 | 1,515 | ||
| 7.67 | 3,361 | 12,930 | 2,162 | 18,453 |  | |
| 7.66 | 48,822 | 77,585 | 73,492 | 199,900 |  | |
| 7.56 | 533,118 | 935,508 | 727,983 | 2,196,608 |  | |
| 7.55 | 8 | 35 | 0 | 43 |  | |
| 7.52 | 1,374,902 | 1,354,961 | 2,338,101 | 5,067,963 |  | |
| 7.5 | 96,969 | 164,376 | 110,822 | 372,167 |  | |
| 7.42 | 2,034 | 7,090 | 459 | 9,583 |  | |
| 7.42 | 2,090 | 7,859 | 1,139 | 11,088 |  | |
| 7.4 | 1 | 4 | 0 | 5 |  | |
| 7.37 | 56,849 | 41,971 | 93,537 | 192,357 |  | |
| 7.35 | 741 | 1,935 | 399 | 3,075 |  | |
| 7.23 | 13,785 | 41,992 | 3,760 | 59,538 |  | |
| 7.22 | 117,672 | 239,624 | 103,852 | 461,148 |  | |
| 7.21 | 98,249 | 189,966 | 72,557 | 360,772 |  | |
| 7.19 | 6,871 | 15,310 | 3,149 | 25,329 |  | |
| 7.18 | 129,745 | 220,188 | 96,924 | 446,857 |  | |
| 7.16 | 52,652 | 84,430 | 44,397 | 181,479 |  | |
| 7.16 | 451 | 996 | 140 | 1,586 |  | |
| 7.16 | 347 | 1,384 | 46 | 1,777 | ||
| 7.14 | 533,800 | 974,431 | 301,051 | 1,809,282 |  | |
| 7.13 | 123,997 | 159,712 | 122,812 | 406,521 |  | |
| 7.12 | 34,503 | 44,155 | 35,334 | 113,992 |  | |
| 7.11 | 847 | 2,456 | 162 | 3,465 |  | |
| 7.11 | 1,783 | 7,008 | 47 | 8,838 |  | |
| 7.09 | 117,992 | 254,792 | 54,428 | 427,211 |  | |
| 7.06 | 388 | 1,026 | 18 | 1,432 | ||
| 6.98 | 39,343 | 67,383 | 16,627 | 123,352 | ||
| 6.95 | 91 | 221 | 0 | 312 | ||
| 6.93 | 150,665 | 189,362 | 115,379 | 455,406 |  | |
| 6.82 | 193,908 | 280,445 | 121,842 | 596,195 |  | |
| 6.77 | 2,426 | 5,256 | 122 | 7,805 |  | |
| 6.77 | 214 | 227 | 199 | 640 |  | |
| 6.74 | 2,260 | 4,076 | 451 | 6,787 |  | |
| 6.65 | 1,328,079 | 1,144,693 | 658,645 | 3,131,417 | 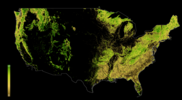 | |
| 6.64 | 31 | 140 | 0 | 171 |  | |
| 6.62 | 1,478 | 2,176 | 418 | 4,072 |  | |
| 6.6 | 14,548 | 27,833 | 1,078 | 43,459 |  | |
| 6.6 | 535,370 | 509,018 | 431,973 | 1,476,361 |  | |
| 6.55 | 4,820 | 7,189 | 1,534 | 13,543 |  | |
| 6.41 | 2,949 | 4,778 | 82 | 7,809 |  | |
| 6.39 | 78,538 | 102,626 | 29,877 | 211,041 |  | |
| 6.39 | 43,043 | 68,243 | 3,516 | 114,801 |  | |
| 6.38 | 8,786 | 14,547 | 1,453 | 24,786 |  | |
| 6.37 | 27 | 38 | 0 | 65 |  | |
| 6.37 | 25,420 | 21,310 | 14,605 | 61,336 |  | |
| 6.31 | 30,143 | 31,939 | 16,349 | 78,431 |  | |
| 6.31 | 5 | 33 | 0 | 37 |  | |
| 6.31 | 9,450 | 14,417 | 1,644 | 25,511 |  | |
| 6.2 | 64,621 | 65,355 | 24,307 | 154,283 |  | |
| 6.18 | 5,261 | 6,016 | 1,910 | 13,187 |  | |
| 6.17 | 235 | 316 | 0 | 551 |  | |
| 6.15 | 7,004 | 7,957 | 2,744 | 17,705 |  | |
| 6.09 | 18,884 | 26,325 | 847 | 46,057 |  | |
| 6.02 | 25,060 | 32,009 | 888 | 57,956 |  | |
| 6 | 86,276 | 89,326 | 33,612 | 209,214 |  | |
| 5.99 | 13,387 | 17,031 | 574 | 30,993 |  | |
| 5.95 | 38,395 | 48,394 | 607 | 87,395 |  | |
| 5.91 | 91,820 | 100,831 | 8,393 | 201,044 |  | |
| 5.88 | 5,064 | 4,522 | 1,076 | 10,662 |  | |
| 5.86 | 4,724 | 3,698 | 1,769 | 10,191 |  | |
| 5.83 | 20,.541 | 22,390 | 1,613 | 44,544 |  | |
| 5.8 | 135,783 | 133,480 | 16,005 | 285,268 | ||
| 5.74 | 12,514 | 12,167 | 2,396 | 27,078 | ||
| 5.7 | 9,274 | 8,702 | 855 | 18,831 |  | |
| 5.59 | 92,986 | 80,564 | 19,252 | 192,801 |  | |
| 5.46 | 1,894 | 1,681 | 3 | 3,577 | ||
| 5.46 | 567 | 478 | 0 | 1,045 |  | |
| 5.45 | 10,013 | 7,251 | 1,947 | 19,211 |  | |
| 5.4 | 22,605 | 18,460 | 1,632 | 42,697 |  | |
| 5.35 | 174,415 | 109,779 | 23,494 | 307,687 |  | |
| 5.35 | 82,551 | 75,353 | 9,588 | 167,492 | ||
| 5.29 | 17,513 | 14,112 | 516 | 32,141 |  | |
| 5.22 | 7,418 | 6,044 | 81 | 13,543 |  | |
| 5.19 | 2,628 | 1,775 | 47 | 4,450 |  | |
| 5.14 | 1,354 | 987 | 0 | 2,340 |  | |
| 5.08 | 144,310 | 83,572 | 9,294 | 237,176 |  | |
| 5.01 | 5,362 | 3,249 | 158 | 8,770 |  | |
| 5.01 | 130,825 | 91,957 | 21,499 | 244,281 |  | |
| 4.94 | 45,489 | 34,968 | 3,196 | 83,653 |  | |
| 4.92 | 15,732 | 10,522 | 379 | 26,633 |  | |
| 4.9 | 81,702 | 54,877 | 2,895 | 139,475 | ||
| 4.85 | 15 | 2 | 0 | 17 | ||
| 4.79 | 51,975 | 31,162 | 11,025 | 94,163 |  | |
| 4.72 | 114 | 92 | 0 | 206 |  | |
| 4.65 | 27,164 | 12,838 | 4,164 | 44,167 | ||
| 4.63 | 120,340 | 66,584 | 11,922 | 198,846 |  | |
| 4.56 | 181 | 85 | 0 | 266 |  | |
| 4.55 | 95 | 50 | 0 | 145 |  | |
| 4.53 | 57,519 | 28,901 | 2,160 | 88,580 |  | |
| 4.52 | 161,987 | 49,496 | 74,121 | 285,604 |  | |
| 4.5 | 6,882 | 3,841 | 46 | 10,769 |  | |
| 4.5 | 59 | 42 | 0 | 101 |  | |
| 4.48 | 57,899 | 23,802 | 3,692 | 85,392 |  | |
| 4.45 | 170 | 49 | 0 | 219 |  | |
| 4.36 | 77,303 | 36,381 | 7,507 | 121,190 |  | |
| 4.34 | 17,615 | 8,165 | 0 | 25,781 |  | |
| 4.23 | 82,770 | 46,013 | 133 | 128,916 |  | |
| 4.22 | 221 | 86 | 0 | 308 |  | |
| 4.21 | 5,054 | 2,501 | 14 | 7,569 |  | |
| 4.2 | 28,427 | 13,558 | 4,702 | 46,686 |  | |
| 4.19 | 19,890 | 9,364 | 518 | 29,772 |  | |
| 4.14 | 170 | 85 | 0 | 255 |  | |
| 4.05 | 8,837 | 2,947 | 0 | 11,784 |  | |
| 4.01 | 7,116 | 2,831 | 12 | 9,959 |  | |
| 3.85 | 58,572 | 18,764 | 5,592 | 82,928 |  | |
| 3.85 | 5,665 | 2,170 | 619 | 8,454 |  | |
| 3.78 | 11,065 | 3,791 | 0 | 14,856 |  | |
| 3.76 | 541 | 115 | 0 | 656 |  | |
| 3.65 | 79,403 | 26,858 | 25 | 106,286 |  | |
| 3.64 | 158,010 | 41,005 | 7,288 | 206,303 |  | |
| 3.64 | 841 | 282 | 0 | 1,123 |  | |
| 3.63 | 77,870 | 20,847 | 91 | 98,808 |  | |
| 3.63 | 65,356 | 17,646 | 4,858 | 87,860 |  | |
| 3.61 | 11,793 | 3,998 | 0 | 15,791 |  | |
| 3.59 | 104 | 9 | 0 | 113 |  | |
| 3.55 | 36,666 | 12,422 | 21 | 49,109 |  | |
| 3.53 | 13,636 | 4,412 | 10 | 18,058 |  | |
| 3.3 | 89,540 | 20,183 | 176 | 109,900 |  | |
| 3.05 | 24,473 | 4,832 | 52 | 29,358 |  | |
| 2.79 | 12 | 0 | 0 | 12 |  | |
| 2.76 | 52,512 | 11,858 | 640 | 65,010 |  | |
| 2.28 | 122,168 | 11,307 | 0 | 133,475 |  | |
| 2.25 | 18,729 | 2,047 | 0 | 20,776 |  | |
| 2.24 | 101,886 | 7,103 | 0 | 108,989 |  | |
| 2.2 | 3,113 | 202 | 0 | 3,315 |  | |
| 2.09 | 38,164 | 2,137 | 0 | 40,301 |  | |
| 1.71 | 32,161 | 1,611 | 0 | 33,772 |  | |
| 1.65 | 29,149 | 2,917 | 35 | 32,101 |  | |
| 1.62 | 24,554 | 930 | 0 | 25,484 |  | |
| 1.36 | 8,803 | 297 | 0 | 9,099 |  | |
| 1.12 | 1,170 | 0 | 0 | 1,170 | ||
| 1.11 | 170 | 2 | 0 | 172 | ||
| 1.06 | 531 | 2 | 0 | 533 |  | |
| 0.92 | 5,283 | 96 | 0 | 5,378 |  | |
| 0.82 | 25,966 | 553 | 0 | 26,519 |  | |
| 0.6 | 5,250 | 72 | 0 | 5,322 |  | |
| 0.56 | 4,772 | 218 | 69 | 5,059 |  | |
| 0.5 | 5,756 | 31 | 0 | 5,787 | ||
| 0.01 | 7 | 0 | 0 | 7 |  |
|
Countries with high mean FLII (8-10)
Countries with medium mean FLII (5-7.99)
Countries with low mean FLII (0-4.99)
|
Background edit
The index was authored by a global team of forest conservation experts, including:[1]
See also edit
References edit
- ^ a b c Grantham, H. S.; Duncan, A.; Evans, T. D.; Jones, K. R.; Beyer, H. L.; Schuster, R.; Walston, J.; Ray, J. C.; Robinson, J. G.; Callow, M.; Clements, T.; Costa, H. M.; DeGemmis, A.; Elsen, P. R.; Ervin, J.; Franco, P.; Goldman, E.; Goetz, S.; Hansen, A.; Hofsvang, E.; Jantz, P.; Jupiter, S.; Kang, A.; Langhammer, P.; Laurance, W. F.; Lieberman, S.; Linkie, M.; Malhi, Y.; Maxwell, S.; Mendez, M.; Mittermeier, R.; Murray, N. J.; Possingham, H.; Radachowsky, J.; Saatchi, S.; Samper, C.; Silverman, J.; Shapiro, A.; Strassburg, B.; Stevens, T.; Stokes, E.; Taylor, R.; Tear, T.; Tizard, R.; Venter, O.; Visconti, P.; Wang, S.; Watson, J. E. M. (2020). "Anthropogenic modification of forests means only 40% of remaining forests have high ecosystem integrity". Nature Communications. 11 (1): 5978. Bibcode:2020NatCo..11.5978G. doi:10.1038/s41467-020-19493-3. ISSN 2041-1723. PMC 7723057. PMID 33293507.
- ^ Elcacho, Joaquim (2020-12-14). "Descubre con este mapa dónde están los mejores bosques de tu país y del mundo" [Discover with this map where are the best forests in your country and in the world]. La Vanguardia (in Spanish). Barcelona. Retrieved 2020-12-16.
- ^ "Anthropogenic modification of forests means only 40% of remaining forests have high ecosystem integrity". Nature-based Solutions Initiative. University of Oxford. 2020-12-10. Retrieved 2020-12-16.
- ^ Попова, Марина (2020-12-09). "Прямое влияние человека обошло стороной 40 процентов современных лесов" [Direct human influence bypassed 40 percent of modern forests] (in Russian). Retrieved 2020-12-16.
- ^ "New Forest Landscape Integrity Index Reveals that Only 40 Percent of World's Forests Have High Integrity". WCS Newsroom. Wildlife Conservation Society. 2020-12-08. Retrieved 2020-12-16.
- ^ Parrish, Jeffrey D.; Braun, David P.; Unnasch, Robert S. (2003). "Are We Conserving What We Say We Are? Measuring Ecological Integrity within Protected Areas". BioScience. 53 (9): 851. doi:10.1641/0006-3568(2003)053[0851:AWCWWS]2.0.CO;2. ISSN 0006-3568.
- ^ Grantham, H. S.; Duncan, A.; Evans, T. D.; Jones, K. R.; Beyer, H. L.; Schuster, R.; Walston, J.; Ray, J. C.; Robinson, J. G.; Callow, M.; Clements, T.; Costa, H. M.; DeGemmis, A.; Elsen, P. R.; Ervin, J.; Franco, P.; Goldman, E.; Goetz, S.; Hansen, A.; Hofsvang, E.; Jantz, P.; Jupiter, S.; Kang, A.; Langhammer, P.; Laurance, W. F.; Lieberman, S.; Linkie, M.; Malhi, Y.; Maxwell, S.; Mendez, M.; Mittermeier, R.; Murray, N. J.; Possingham, H.; Radachowsky, J.; Saatchi, S.; Samper, C.; Silverman, J.; Shapiro, A.; Strassburg, B.; Stevens, T.; Stokes, E.; Taylor, R.; Tear, T.; Tizard, R.; Venter, O.; Visconti, P.; Wang, S.; Watson, J. E. M. (2020). "Anthropogenic modification of forests means only 40% of remaining forests have high ecosystem integrity - Supplementary Material". Nature Communications. 11 (1): 5978. doi:10.1038/s41467-020-19493-3. ISSN 2041-1723. PMC 7723057. PMID 33293507.
External links edit
- Official site & map