
KNOWPIA
WELCOME TO KNOWPIA

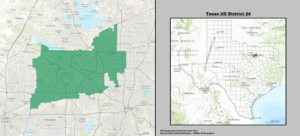
Texas's 24th congressional district 
Summary
Texas' 24th congressional district of the United States House of Representatives covers much of the suburban area in between Fort Worth and Dallas in the state of Texas and centers along the Dallas–Tarrant county line.
| Texas's 24th congressional district | |||
|---|---|---|---|
 Texas's 24th congressional district since January 3, 2023 | |||
| Representative |
| ||
| Distribution |
| ||
| Population (2022) | 760,070[2] | ||
| Median household income | $106,888[2] | ||
| Ethnicity |
| ||
| Cook PVI | R+10[3] | ||
The district has about 529,000 potential voters (citizens, age 18+). Of these, 57% are White, 16% Latino, 14% Black, and 10% Asian. Immigrants make up 4% of the district's potential voters. Median income among households (with one or more potential voter) in the district is about $81,900, and 46% hold a bachelor's or higher degree.[4]
Election results from presidential races edit
Results under previous lines (vary by year)
| Year | Result |
|---|---|
| 2000 | Bush (R): 59 - 38% |
| 2004 | Bush (R): 65 - 35% |
| 2008 | McCain (R): 55 – 44% |
| 2012 | Romney (R): 60 – 38% |
| 2016 | Trump (R): 51 – 45% |
| 2020 | Biden (D): 52 – 47% |
Election results from recent statewide races edit
Results under current lines (since 2023)[5]
| Year | Office | Result |
|---|---|---|
| 2014 | Senate | Cornyn 74 - 26% |
| Governor | Abbott 69 - 31% | |
| 2016 | President | Trump 59 - 35% |
| 2018 | Senate | Cruz 57 - 42% |
| Governor | Abbott 64 - 34% | |
| Lieutenant Governor | Patrick 58 - 39% | |
| Attorney General | Paxton 57 - 41% | |
| 2020 | President | Trump 55 - 43% |
| Senate | Cornyn 59 - 38% | |
| 2022 | Governor | Abbott 58 - 41% |
| Lieutenant Governor | Patrick 55 - 42% | |
| Attorney General | Paxton 55 - 41% [6] |
List of members representing the district edit


Recent election results edit
| 2004 • 2006 • 2008 • 2010 • 2012 • 2014 • 2016 • 2018 • 2020 |
2004 edit
| Party | Candidate | Votes | % | ±% | |
|---|---|---|---|---|---|
| Republican | Kenny Marchant | 154,435 | 64.0% | +30.0 | |
| Democratic | Gary Page | 82,599 | 34.2% | -30.5 | |
| Libertarian | James Lawrence | 4,340 | 1.8% | +0.4 | |
| Majority | 71,836 | ||||
| Turnout | 241,374 | 29.8% | |||
| Republican gain from Democratic | Swing | +30.2 | |||
2006 edit
| Party | Candidate | Votes | % | ±% | |
|---|---|---|---|---|---|
| Republican | Kenny Marchant (incumbent) | 83,620 | 60.0% | -4.0 | |
| Democratic | Gary Page | 51,833 | 37.0% | +2.8 | |
| Libertarian | Mark Frohman | 4,211 | 3.0% | +1.2 | |
| Republican hold | |||||
2008 edit
| Party | Candidate | Votes | % | ±% | |
|---|---|---|---|---|---|
| Republican | Kenny Marchant (incumbent) | 151,740 | 55.91% | -4.09 | |
| Democratic | Tom Love[10] | 111,649 | 41.14% | +4.14 | |
| Libertarian | David A. Casey[11] | 7,969 | 2.93% | +0.13 | |
| Republican hold | |||||
2010 edit
| Party | Candidate | Votes | % | ±% | |
|---|---|---|---|---|---|
| Republican | Kenny Marchant (incumbent) | 81.6% | |||
| Libertarian | David Sparks | 18.4% | |||
| Republican hold | |||||
2012 edit
| Party | Candidate | Votes | % | ±% | |
|---|---|---|---|---|---|
| Republican | Kenny Marchant (incumbent) | 61% | |||
| Democratic | Tim Rusk | 36% | |||
| Libertarian | John Stathas | 3% | |||
| Republican hold | |||||
2014 edit
| Party | Candidate | Votes | % | ±% | |
|---|---|---|---|---|---|
| Republican | Kenny Marchant (incumbent) | 93,446 | 65.1% | ||
| Democratic | Patrick McGehearty | 46,360 | 32.3% | ||
| Libertarian | Mike Kolls | 3,799 | 2.6% | ||
| Republican hold | |||||
2016 edit
| Party | Candidate | Votes | % | ±% | |
|---|---|---|---|---|---|
| Republican | Kenny Marchant (incumbent) | 154,364 | 56.2% | -8.9 | |
| Democratic | Jan McDowell | 107,845 | 39.3% | +7.0 | |
| Libertarian | Mike Kolls | 8,574 | 3.1% | +0.5 | |
| Republican hold | |||||
2018 edit
| Party | Candidate | Votes | % | ±% | |
|---|---|---|---|---|---|
| Republican | Kenny Marchant (incumbent) | 133,317 | 50.6% | -5.6 | |
| Democratic | Jan McDowell | 125,231 | 47.5% | +8.2 | |
| Libertarian | Mike Kolls | 4,870 | 1.8% | -1.3 | |
| Republican hold | |||||
2020 edit
| Party | Candidate | Votes | % | ±% | |
|---|---|---|---|---|---|
| Republican | Beth Van Duyne | 167,489 | 48.8% | -1.8 | |
| Democratic | Candace Valenzuela | 162,846 | 47.5% | - | |
| Libertarian | Darren Hamilton | 5,630 | 1.6% | -0.2 | |
| Independent | Steve Kuzmich | 4,218 | 1.2% | ||
| Independent | Mark Bauer | 2,903 | 0.8% | ||
| Total votes | 342,874 | 100.0% | |||
| Republican hold | |||||
2022 edit
| Party | Candidate | Votes | % | ±% | |
|---|---|---|---|---|---|
| Republican | Beth Van Duyne | 177,947 | 59.7% | +10.9 | |
| Democratic | Jan McDowell | 119,878 | 40.2% | -7.3 | |
| Total votes | 297,825 | 100.0% | |||
| Republican hold | |||||
See also edit
References edit
- ^ "Congressional Districts Relationship Files (State-based)". U.S. Census Bureau. Archived from the original on April 2, 2013.
- ^ a b Center for New Media & Promotion (CNMP), US Census Bureau. "My Congressional District". www.census.gov.
- ^ "2022 Cook PVI: District Map and List". Cook Political Report. Retrieved January 10, 2023.
- ^ "Representing US: 2020 Voter Profiles". APM Research Lab. Retrieved October 22, 2020.
- ^ "2022 Cook PVI: District Map and List". Cook Political Report. Retrieved January 23, 2023.
- ^ "TX 2022 Congressional". Dave’s Redistricting App. Retrieved July 15, 2023.
- ^ "District Population Analysis with County Subtotals | CONGRESSIONAL DISTRICTS - PLANC2100" (PDF). Capitol Data Portal. Texas Legislative Council. August 26, 2021. Archived (PDF) from the original on June 27, 2022. Retrieved January 1, 2023.
- ^ "District Population Analysis with County Subtotals | CONGRESSIONAL DISTRICTS - PLANC2193" (PDF). Capitol Data Portal. Texas Legislative Council. October 17, 2021. Archived (PDF) from the original on December 25, 2022. Retrieved January 1, 2023.
- ^ 2008 Election Results accessed November 5, 2008
- ^ Tom Love 08 Archived September 3, 2008, at the Wayback Machine accessed May 25, 2008
- ^ David A. Casey for Congress accessed March 21, 2012
- ^ 2010 Election Results accessed April 5, 2013
- ^ 2012 Election Results accessed April 5, 2013
- ^ "Texas Election Results 2014: House Map by District, Live Midterm Voting Updates". Politico. Retrieved July 2, 2020.
- ^ "Texas Election Results 2016: House Live Map by District, Real-Time Voting Updates". Politico. Retrieved January 30, 2017.
- ^ "Texas' 24th Congressional District election, 2018". Ballotpedia. Retrieved March 5, 2019.[title missing]
- ^ "Texas' 24th Congressional District election, 2020". Ballotpedia. Retrieved November 10, 2020.
- ^ "Texas' 24th Congressional District election, 2022". Ballotpedia. Retrieved March 20, 2023.
- Martis, Kenneth C. (1989). The Historical Atlas of Political Parties in the United States Congress. New York: Macmillan Publishing Company.
- Martis, Kenneth C. (1982). The Historical Atlas of United States Congressional Districts. New York: Macmillan Publishing Company.
- Congressional Biographical Directory of the United States 1774–present
Further reading edit
- Amber Phillips (September 25, 2020), "The House seats most likely to flip in November", Washingtonpost.com
32°55′10″N 97°00′46″W / 32.91944°N 97.01278°W