


Summary
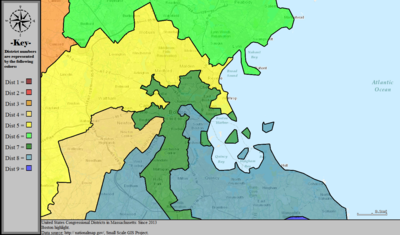
Massachusetts is currently divided into nine congressional districts, each represented by a member of the United States House of Representatives. After the 2010 census, the number of seats in Massachusetts was decreased from 10 to nine, due to the State's low growth in population since the year 2000. This mandatory redistricting after the 2010 census eliminated Massachusetts's 10th congressional district, as well as causing a major shift in how the state's congressional districts are currently drawn.
Current districts and representatives edit
List of members of the United States House delegation from Massachusetts in the 118th Congress, their terms, their district boundaries, and the district political ratings, according to the CPVI. The delegation has a total of nine members, all of whom are members of the Democratic party.
| Current U.S. representatives from Massachusetts | |||||
|---|---|---|---|---|---|
| District | Member (Residence)[1] |
Party | Incumbent since | CPVI (2022)[2] |
District map |
| 1st |  Richard Neal (Springfield) |
Democratic | January 3, 1989 | D+9 |  |
| 2nd |  Jim McGovern (Worcester) |
Democratic | January 3, 1997 | D+13 |  |
| 3rd |  Lori Trahan (Westford) |
Democratic | January 3, 2019 | D+11 |  |
| 4th |  Jake Auchincloss (Newton) |
Democratic | January 3, 2021 | D+12 |  |
| 5th |  Katherine Clark (Revere) |
Democratic | December 12, 2013 | D+23 |  |
| 6th |  Seth Moulton (Salem) |
Democratic | January 3, 2015 | D+11 |  |
| 7th |  Ayanna Pressley (Boston) |
Democratic | January 3, 2019 | D+35 |  |
| 8th |  Stephen Lynch (Boston) |
Democratic | October 16, 2001 | D+15 |  |
| 9th |  Bill Keating (Bourne) |
Democratic | January 3, 2011 | D+6 |  |
History of apportionment edit
| Census year |
Resident population[nb 1] |
Number of representatives[nb 2] |
Constituents per representative (Massachusetts) |
Constituents per representative (nationally) |
|---|---|---|---|---|
| 1789 | No census | 8 | N/A | N/A |
| 1790 | 378,787 | 14 | 27,056 | 30,000 |
| 1800 | 422,845 | 17 | 24,873 | 33,000 |
| 1810 | 472,040 | 20 | 23,602 | 35,000 |
| 1820 | 523,287 | 13 | 40,253 | 40,000 |
| 1830 | 610,408 | 12 | 50,867 | 47,700 |
| 1840 | 737,699 | 10 | 73,770 | 70,680 |
| 1850 | 994,514 | 11 | 90,410 | 93,425 |
| 1860 | 1,231,066 | 10 | 123,107 | 127,381 |
| 1870 | 1,457,351 | 11 | 132,486 | 131,425 |
| 1880 | 1,783,085 | 12 | 148,590 | 151,912 |
| 1890 | 2,238,947 | 13 | 172,227 | 173,901 |
| 1900 | 2,805,346 | 14 | 200,381 | 194,182 |
| 1910 | 3,366,416 | 16 | 210,401 | 212,407 |
| 1920 | 3,852,356 | 16 | N/A | N/A |
| 1930 | 4,249,614 | 15 | 283,307 | 280,675 |
| 1940 | 4,316,721 | 14 | 308,337 | 301,164 |
| 1950 | 4,690,514 | 14 | 335,037 | 344,587 |
| 1960 | 5,148,578 | 12 | 429,048 | 410,481 |
| 1970 | 5,689,170 | 12 | 477,223 | 469,088 |
| 1980 | 5,737,093 | 11 | 521,549 | 519,235 |
| 1990 | 6,016,425 | 10 | 602,905 | 572,466 |
| 2000 | 6,349,097 | 10 | 635,557 | 646,952 |
| 2010 | 6,547,629 | 9[3][4] | 728,849 | 710,767 |
Source: U.S. Census Bureau.
Enumeration trends edit
After the 1890 census, and starting with the 53rd United States Congress in 1893, Massachusetts's congressional districts were numbered west to east, with the first district in the west (Berkshire County) and the highest numbered district at Cape Cod. Before then, the district numeration was not as consistent; sometimes running east to west, other times going counter-clockwise around Boston.
Historical and present district boundaries edit
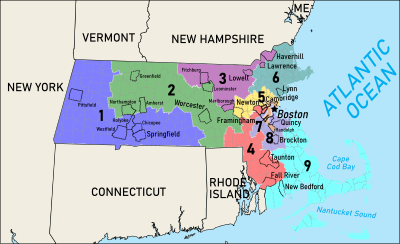
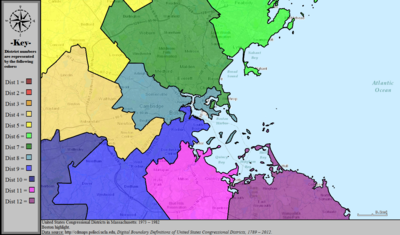
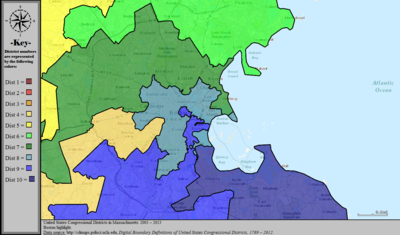
Table of United States congressional district boundary maps in the State of Massachusetts, presented chronologically.[5] All redistricting events that took place in Massachusetts between 1973 and 2013 are shown.
| Year | Statewide map | Boston highlight |
|---|---|---|
| 1973–1982 | 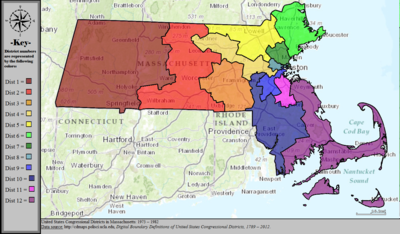
|
|
| 1983–1992 | 
|

|
| 1993–2002 | 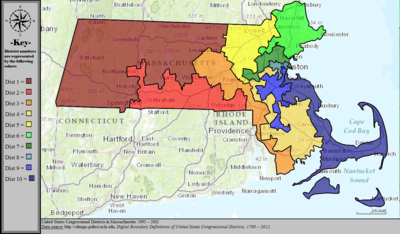
|
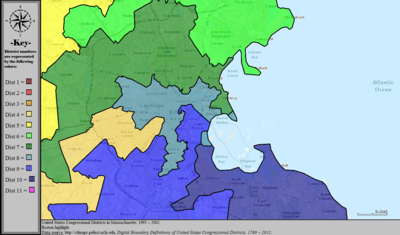
|
| 2003–2013 | 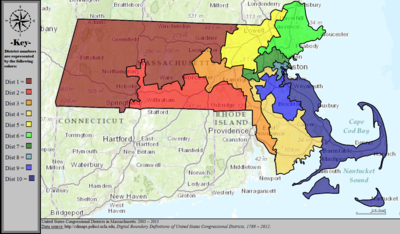
|
|
| 2013-2023 | 
|
|
| Since 2023 |
|
-
 The Commonwealth's districts, as of 1796.
 -
 The Commonwealth's districts, as of 1842.
 -
 The Commonwealth's districts, as of 1891.
 -
 The Commonwealth's districts, as of 1901.


See also edit
Notes edit
- ^ The resident population excludes the overseas population.
- ^ Congressional apportionment for each state is based upon (1) the resident population and (2) the overseas U.S. military and federal civilian employees (and their dependents living with them) allocated to their home state, as reported by the employing federal agencies.
References edit
- ^ "Office of the Clerk, U.S. House of Representatives". clerk.house.gov. Retrieved January 6, 2022.
- ^ "2022 Cook PVI: District Map and List". Cook Political Report. Retrieved January 8, 2023.
- ^ "Deval Patrick Signs New Massachusetts Map", Roll Call, Washington, DC, November 21, 2011
- ^ "Massachusetts Redistricting Analysis". Daily Kos. November 14, 2011. Retrieved November 27, 2013.
- ^ "Digital Boundary Definitions of United States Congressional Districts, 1789–2012". Retrieved October 18, 2014.
Further reading edit
19th century edit
- "State Apportionment". Massachusetts Register ... for 1843. Boston: Loring.
- John Hayward (1849). "Congressional Districts". Gazetteer of Massachusetts. Boston: J.P. Jewett & Co.
- "Massachusetts". Congressional Directory for the Second Session of the Thirty-Seventh Congress. Washington DC: House of Representatives. 1861.
- "Congressional Districts". Massachusetts Register 1862. Boston: Adams, Sampson, & Co.
- Ben. Perley Poore (1869). "Massachusetts". Congressional Directory for the First Session of the Forty-First Congress (2nd ed.). Washington DC: Government Printing Office.
- Ben. Perley Poore (1878). "Massachusetts". Congressional Directory: 45th Congress (3rd ed.). Washington DC: Government Printing Office.
- Ben. Perley Poore (1882). "Massachusetts". Congressional Directory: 47th Congress (3rd ed.). Washington DC: Government Printing Office.
- Ben. Perley Poore (1884). "Massachusetts". Congressional Directory: Forty-Eighth Congress (2nd ed.). Washington DC: Government Printing Office.
- W.H. Michael (1889). "Massachusetts". Official Congressional Directory: Fiftieth Congress (2nd ed.). Washington DC: Government Printing Office.
- Francis M. Cox (1893). "Massachusetts". Official Congressional Directory: Fifty-Third Congress (2nd ed.). Washington DC: Government Printing Office.
- L.A. Coolidge (1897). "Massachusetts". Official Congressional Directory: Fifty-Fifth Congress. Washington DC: Government Printing Office.
20th century edit
- "Massachusetts". Official Congressional Directory: Fifty-Sixth Congress (2nd ed.). Washington DC: Government Printing Office. 1900.
- A.J. Halford (1903). "Massachusetts". Official Congressional Directory: Fifty-Eighth Congress. Washington DC: Government Printing Office.
- A.J. Halford (1909). "Massachusetts". Congressional Directory: 60th Congress (2nd ed.). Washington DC: Government Printing Office.
- "Massachusetts". Official Congressional Directory: 64th Congress (2nd ed.). Washington DC: Government Printing Office. 1916.
- Commonwealth of Massachusetts (1921), "Population of Congressional Districts", Population of Massachusetts as determined by the fourteenth census of the United States 1920, Boston: Wright & Potter
- "Massachusetts". Official Congressional Directory: 68th Congress (3rd ed.). Washington DC: Government Printing Office. 1924.
- "Massachusetts". Official Congressional Directory: 70th Congress. Washington DC: Government Printing Office. 1927.
- "Massachusetts". Official Congressional Directory: 73rd Congress (2nd ed.). Washington DC: Government Printing Office. 1934.
- "Massachusetts". Official Congressional Directory: 75th Congress (2nd ed.). Washington DC: Government Printing Office. 1938.
- Commonwealth of Massachusetts (1941), "Population of Congressional Districts", Population of Massachusetts as determined by the sixteenth census of the United States, 1940, Boston: Wright & Potter, OCLC 10056477,
House No. 2849
- "Massachusetts". Official Congressional Directory: 80th Congress. Washington DC: Government Printing Office. 1947.
- "Massachusetts". Official Congressional Directory: 81st Congress. Washington DC: Government Printing Office. 1949.
- "Massachusetts". Official Congressional Directory: 83rd Congress. Washington DC: Government Printing Office. 1953.
- "Massachusetts". Official Congressional Directory: 85th Congress. Washington DC: Government Printing Office. 1958.
- "Massachusetts". Congressional Directory: 87th Congress. Washington DC: Government Printing Office. 1961.
- "Massachusetts". Official Congressional Directory: 88th Congress. Washington DC: Government Printing Office. 1963.
- "Massachusetts". Official Congressional Directory: 90th Congress. Washington DC: Government Printing Office. 1968.
- "Massachusetts". Official Congressional Directory: 92nd Congress. Washington DC: Government Printing Office. 1972.
- "Massachusetts". Official Congressional Directory: 93rd Congress. Washington DC: Government Printing Office. 1973.
- "Massachusetts", 1977 Official Congressional Directory: 95th Congress, Washington DC: U.S. Government Printing Office, 1977
- "Massachusetts". 1985-1986 Official Congressional Directory: 99th Congress. Washington DC: Government Printing Office. 1985.
- "Massachusetts". 1991-1992 Official Congressional Directory: 102nd Congress. Washington DC: Government Printing Office. 1991.
- "Congressional Biographies: Massachusetts", Congressional Directory for the 105th Congress (1997-1998), Washington DC: U.S. Government Printing Office, 1997
21st century edit
- "Congressional Biographies: Massachusetts", Congressional Directory for the 107th Congress (2001 - 2002), Washington DC: U.S. Government Printing Office, 2001
- "Massachusetts", 2003-2004 Official Congressional Directory for the 108th Congress, Washington DC: U.S. Government Printing Office, 2003
External links edit
- Massachusetts Congressional Districts map, 2004