
KNOWPIA
WELCOME TO KNOWPIA

List of Australian states and territories by gross state product 
Summary
This is the most recent list of Australian states and territories by gross state product (GSP) and GSP per capita. Also included are the GSP and population growth tables as well as a comparison table showing the surplus/deficit between state final demand (SFD) and GSP for the same financial year. All the data was taken from the Australian Bureau of Statistics website.
States and territories by GSP per capita edit

> 100,000
100,000 - 80,000
80,000 - 70,000
70,000 - 60,000
< 60,000
| State or territory | GSP per capita (A$, 2021–22) |
GSP per capita growth (2021–22) |
GSP per capita as a ratio to national |
|---|---|---|---|
| 136,577 | 1.632 | ||
| 104,506 | 1.249 | ||
| 99,969 | 1.195 | ||
| 81,612 | 0.975 | ||
| 73,030 | 0.873 | ||
| 76,357 | 0.874 | ||
| 68,777 | 0.822 | ||
| 64,408 | 0.770 | ||
| 83,678 | 1.000 |
edit

> 500,000
500,000 - 300,000
200,000 - 100,000
< 100,000
| State or territory | Share of National Economy (%, 2021–22)[1] |
GSP (million $AUD, 2009–10) |
GSP (million $AUD, 2022-23) |
Annual Growth Rate (2022-23) |
|---|---|---|---|---|
| 30.65% | 500,555 | 777,299 | ||
| 23.24% | 360,958 | 568,866 | ||
| 17.84% | 295,005 | 503,351 | ||
| 17.50% | 213,988 | 445,348 | ||
| 5.76% | 98,685 | 142,035 | ||
| 2.10% | 29,917 | 51,206 | ||
| 1.70% | 27,350 | 40,527 | ||
| 1.21% | 26,435 | 32,595 | ||
| 100.00% | 1,542,946 | 2,561,227 |
States and territories by population growth edit
| State or territory | Population[2] (June 2010) |
Population (June 2020) |
National population share (%, June 2020) |
Annual Growth Rate (2019–20) |
Comparison as multiple of (June 2010 vs. June 2020) |
|---|---|---|---|---|---|
| 5,461,101 | 6,694,884 | 26.07% | 1.226 | ||
| 361,766 | 431,114 | 1.68% | 1.192 | ||
| 4,404,744 | 5,174,437 | 20.15% | 1.175 | ||
| 2,290,845 | 2,661,936 | 10.36% | 1.162 | ||
| 7,144,292 | 8,164,128 | 31.79% | 1.143 | ||
| 1,627,322 | 1,769,319 | 6.89% | 1.087 | ||
| 229,778 | 245,980 | 0.96% | 1.071 | ||
| 508,847 | 540,569 | 2.10% | 1.062 | ||
| 22,028,695 | 25,682,367 | 100.00% | 1.166 |
States and territories by comparison between SFD and GSP edit
| State or territory | SFD[3] (million A$, 2019–20) |
GSP (million A$, 2018–19) |
Surplus / Deficit |
|---|---|---|---|
| 603,043 | 629,117 | 26,074 | |
| 483,407 | 461,248 | −22,159 | |
| 361,478 | 367,468 | 5,990 | |
| 203,910 | 288,225 | 84,315 | |
| 118,626 | 109,843 | −8,783 | |
| 54,040 | 39,956 | −14,084 | |
| 35,142 | 31,993 | −4,099 | |
| 23,482 | 24,830 | 1,348 | |
| 1,884,078 | 1,952,680 | 68,602 |
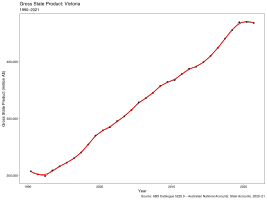
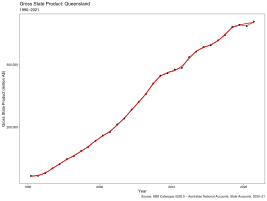
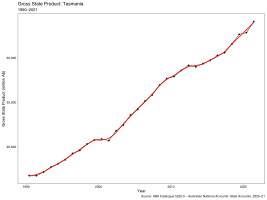
Historical gross state product (since 1989–90) edit
- Gross State Product (million A$) since 1989–90
-

-
-
-

-

-

-
-

-


See also edit
References edit
- ^ "Australian National Accounts: State Accounts". Australian Bureau of Statistics. 18 November 2022. Retrieved 21 October 2023.
- ^ "3101.0 – Australian Demographic Statistics, Jun 2020". Australian Bureau of Statistics. Retrieved 25 December 2020.
- ^ "State Final Demand, 2019–20) Financial Year". Australian Bureau of Statistics. Retrieved 25 December 2020.