


Summary
Le Mont-Dore is a commune in the suburbs of Nouméa in the South Province of New Caledonia, an overseas territory of France[3] in the Pacific Ocean.
Le Mont-Dore | |
|---|---|
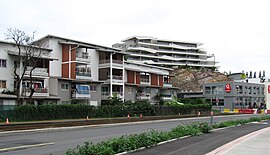 The High Street, Le Mont-Dore | |
 Coat of arms | |
 Location of the commune (in red) within New Caledonia | |
Location of Le Mont-Dore Coordinates: .mw-parser-output .geo-default,.mw-parser-output .geo-dms,.mw-parser-output .geo-dec{display:inline}.mw-parser-output .geo-nondefault,.mw-parser-output .geo-multi-punct,.mw-parser-output .geo-inline-hidden{display:none}.mw-parser-output .longitude,.mw-parser-output .latitude{white-space:nowrap}22°12′57″S 166°27′59″E / 22.2157°S 166.4665°E | |
| Country | France |
| Sui generis collectivity | New Caledonia |
| Province | South Province |
| Government | |
| • Mayor (2020–2026) | Eddie Lecourieux[1] |
| Area 1 | 643.0 km2 (248.3 sq mi) |
| Population (2019)[2] | 27,620 |
| • Density | 43/km2 (110/sq mi) |
| Ethnic distribution | |
| • 2019 | Europeans 26.36% Kanaks 24.86% Wallisians and Futunans 14.8% Mixed 15.34% Other 18.65% |
| Time zone | UTC+11:00 |
| INSEE/Postal code | 98817 /98809 |
| Elevation | 0–825 m (0–2,707 ft) (avg. 20 m or 66 ft) |
| 1 New Caledonia Land Register (DITTT) data, which exclude lakes and ponds larger than 1 km² (0.386 sq mi or 247 acres) as well as the estuaries of rivers. | |
Geography edit
Climate edit
Le Mont-Dore has a tropical rainforest climate (Köppen Af), closely bordering upon a tropical monsoon climate (Am). The average annual temperature in Le Mont-Dore is 23.2 °C (73.8 °F). The average annual rainfall is 1,775.6 mm (69.91 in) with March as the wettest month. The temperatures are highest on average in February, at around 26.6 °C (79.9 °F), and lowest in July, at around 19.5 °C (67.1 °F). The highest temperature ever recorded in Le Mont-Dore was 37.8 °C (100.0 °F) on 29 December 2010; the coldest temperature ever recorded was 7.8 °C (46.0 °F) on 22 August 2009.
| Climate data for Le Mont-Dore (La Coulée, 1991−2020 normals, extremes 1993−present) | |||||||||||||
|---|---|---|---|---|---|---|---|---|---|---|---|---|---|
| Month | Jan | Feb | Mar | Apr | May | Jun | Jul | Aug | Sep | Oct | Nov | Dec | Year |
| Record high °C (°F) | 36.7 (98.1) |
37.7 (99.9) |
36.1 (97.0) |
35.2 (95.4) |
32.1 (89.8) |
31.7 (89.1) |
31.8 (89.2) |
30.8 (87.4) |
35.9 (96.6) |
34.7 (94.5) |
35.8 (96.4) |
37.8 (100.0) |
37.8 (100.0) |
| Mean daily maximum °C (°F) | 31.0 (87.8) |
31.3 (88.3) |
30.3 (86.5) |
28.6 (83.5) |
26.5 (79.7) |
25.1 (77.2) |
24.3 (75.7) |
24.8 (76.6) |
26.6 (79.9) |
28.2 (82.8) |
29.5 (85.1) |
30.8 (87.4) |
28.1 (82.6) |
| Daily mean °C (°F) | 26.3 (79.3) |
26.6 (79.9) |
26.0 (78.8) |
24.3 (75.7) |
22.2 (72.0) |
20.7 (69.3) |
19.5 (67.1) |
19.6 (67.3) |
20.9 (69.6) |
22.6 (72.7) |
24.0 (75.2) |
25.6 (78.1) |
23.2 (73.8) |
| Mean daily minimum °C (°F) | 21.5 (70.7) |
22.1 (71.8) |
21.8 (71.2) |
20.1 (68.2) |
17.8 (64.0) |
16.2 (61.2) |
14.6 (58.3) |
14.5 (58.1) |
15.3 (59.5) |
17.0 (62.6) |
18.5 (65.3) |
20.3 (68.5) |
18.3 (64.9) |
| Record low °C (°F) | 15.8 (60.4) |
15.7 (60.3) |
16.3 (61.3) |
13.3 (55.9) |
10.4 (50.7) |
9.5 (49.1) |
7.8 (46.0) |
7.8 (46.0) |
8.9 (48.0) |
9.7 (49.5) |
11.8 (53.2) |
13.1 (55.6) |
7.8 (46.0) |
| Average precipitation mm (inches) | 199.3 (7.85) |
248.2 (9.77) |
317.2 (12.49) |
211.0 (8.31) |
140.8 (5.54) |
113.8 (4.48) |
103.9 (4.09) |
103.5 (4.07) |
62.0 (2.44) |
67.2 (2.65) |
79.9 (3.15) |
128.8 (5.07) |
1,775.6 (69.91) |
| Average precipitation days (≥ 1.0 mm) | 13.7 | 14.9 | 16.8 | 15.5 | 14.6 | 12.2 | 12.5 | 10.8 | 7.7 | 8.4 | 7.7 | 10.4 | 145.1 |
| Source: Météo-France[4] | |||||||||||||
Population edit
| Year | Pop. | ±% p.a. |
|---|---|---|
| 1956 | 1,288 | — |
| 1963 | 2,640 | +10.80% |
| 1969 | 4,809 | +10.51% |
| 1976 | 10,659 | +12.04% |
| 1983 | 14,616 | +4.61% |
| 1989 | 16,370 | +1.91% |
| 1996 | 20,780 | +3.47% |
| 2004 | 24,195 | +1.92% |
| 2009 | 25,683 | +1.20% |
| 2014 | 27,155 | +1.12% |
| 2019 | 27,620 | +0.34% |
| Source: ISEE[5] | ||
Twin towns – sister cities edit
Le Mont-Dore is twinned with:[6]
 Arue, French Polynesia
 Bélep, New Caledonia
 Luganville, Vanuatu
- Nuku-Hiva, French Polynesia
- Pouébo, New Caledonia
 Sunshine Coast, Australia
 Yogyakarta, Indonesia[7]
Notable people edit
- Réginald Bernut, a local politician
- Ilaïsaane Lauouvéa, former member of congress
References edit
- ^ "Répertoire national des élus: les maires" (in French). data.gouv.fr, Plateforme ouverte des données publiques françaises. 4 May 2022.
- ^ Population, ménages et logement par commune, en 2019, Institut de la statistique et des études économiques Nouvelle-Calédonie
- ^ "Commune du Mont-Dore, Nouvelle-Calédonie". Commune du Mont-Dore.
- ^ "Fiche Climatologique Statistiques 1991-2020 et records" (PDF). Météo-France. Retrieved August 25, 2022.
- ^ ISEE. "Structure de la population et évolutions: La population aux différents recensements". Retrieved 23 February 2021.
- ^ "Jumelages". mont-dore.nc (in French). Le Mont-Dore. Retrieved 2021-07-20.
- ^ "Jumelage entre Yogyakarta et Mont-Dore (Nelle Calédonie)". id.ambafrance.org (in French). Ambassade de France en Indonésie et au Timor oriental. 2018-09-14. Retrieved 2021-07-20.
External sites edit
 Media related to Le Mont-Dore (Nouvelle-Calédonie) at Wikimedia Commons
 Le Mont-Dore travel guide from Wikivoyage