


Summary
The electoral history of Joe Biden, the 46th and current president of the United States, began in 1970.[1] Biden served as the 47th vice president (2009–2017), and as a United States senator from Delaware (1973–2009). Biden is the oldest elected and serving president, the second Catholic president, after John F. Kennedy, and the first president from Delaware.

A member of the Democratic Party, Biden was elected to the New Castle County Council in 1970, and became the seventh-youngest senator in American history when he was elected to the U.S. Senate from Delaware in 1972, at the age of 29. He was re-elected to the Senate six times, and was the fourth-most senior senator. He ran unsuccessfully for the Democratic presidential nomination in both 1988 and 2008.
In January 2009, Biden resigned from the Senate, to serve as Barack Obama's vice president, after they won the 2008 presidential election. They were re-elected to a second term in 2012.
Biden announced his candidacy in the 2020 presidential election on April 25, 2019.[2] A total of 29 major candidates declared their candidacies for the primaries, the largest field of presidential candidates for any American political party since 1972;[3] but over time, the field narrowed down to Biden and Senator Bernie Sanders from Vermont.[4] Eventually, Sanders withdrew from the race, and Biden became the presumptive Democratic nominee in April 2020.[5] Biden reached the delegate threshold needed to secure the nomination in June 2020.[6] He defeated incumbent president Donald Trump in the general election, with 306 electoral votes to Trump's 232. Biden received more than 81 million votes, the most votes ever cast for a candidate in a U.S. presidential election.[7]
County council election (1970) edit
| Party | Candidate | Votes | % | ||
|---|---|---|---|---|---|
| Democratic | Joseph R. Biden, Jr. | 10,573 | 55.41 | ||
| Republican | Lawrence T. Messick (incumbent) | 8,192 | 42.93 | ||
| American | Kenneth A. Horner | 317 | 1.66 | ||
| Total votes | 19,082 | 100.00 | |||
| Democratic gain from Republican | |||||
U.S. Senate elections (1972–2008) edit
1972 edit

| Party | Candidate | Votes | % | ||
|---|---|---|---|---|---|
| Democratic | Joe Biden | 116,006 | 50.48 | ||
| Republican | J. Caleb Boggs (incumbent) | 112,844 | 49.10 | ||
| American | Henry Majka | 803 | 0.35 | ||
| Prohibition | Herbert B. Wood | 175 | 0.08 | ||
| Total votes | 229,828 | 100.00 | |||
| Democratic gain from Republican | |||||
1978 edit
| Party | Candidate | Votes | % | ||
|---|---|---|---|---|---|
| Democratic | Joe Biden (incumbent) | 93,930 | 57.96 | ||
| Republican | James H. Baxter Jr. | 66,479 | 41.02 | ||
| American | Donald G. Gies | 1,663 | 1.03 | ||
| Total votes | 162,072 | 100.00 | |||
| Democratic hold | |||||
1984 edit

| Party | Candidate | Votes | % | ||
|---|---|---|---|---|---|
| Democratic | Joe Biden (incumbent) | 147,831 | 60.11 | ||
| Republican | John M. Burris | 98,101 | 39.89 | ||
| Total votes | 245,932 | 100.00 | |||
| Democratic hold | |||||
1990 edit

| Party | Candidate | Votes | % | ||
|---|---|---|---|---|---|
| Democratic | Joe Biden (incumbent) | 112,918 | 62.68 | ||
| Republican | M. Jane Brady | 64,554 | 35.83 | ||
| Libertarian | Lee Rosenbaum | 2,680 | 1.49 | ||
| Write-in | 5 | 0.00 | |||
| Total votes | 180,157 | 100.00 | |||
| Democratic hold | |||||
1996 edit
| Party | Candidate | Votes | % | ||
|---|---|---|---|---|---|
| Democratic | Joe Biden (incumbent) | 165,465 | 60.04 | ||
| Republican | Ray Clatworthy | 105,088 | 38.13 | ||
| Libertarian | Lee Rosenbaum | 3,340 | 1.21 | ||
| Natural Law | Jacqueline Kossoff | 1,698 | 0.62 | ||
| Total votes | 275,591 | 100.00 | |||
| Democratic hold | |||||
2002 edit
| Party | Candidate | Votes | % | ||
|---|---|---|---|---|---|
| Democratic | Joe Biden (incumbent) | 135,253 | 58.22 | ||
| Republican | Ray Clatworthy | 94,793 | 40.80 | ||
| Independent | Bud Barros | 996 | 0.43 | ||
| Libertarian | Raymond Buranello | 922 | 0.40 | ||
| Natural Law | Robert E. Mattson | 350 | 0.15 | ||
| Total votes | 232,314 | 100.00 | |||
| Democratic hold | |||||
2008 edit

| Party | Candidate | Votes | % | ||
|---|---|---|---|---|---|
| Democratic | Joe Biden (incumbent) | 257,539 | 64.69 | ||
| Republican | Christine O'Donnell | 140,595 | 35.31 | ||
| Total votes | 398,134 | 100.00 | |||
| Democratic hold | |||||
Presidential primaries (1984–1988) edit
1984 edit
| Candidate | Votes | % | |
|---|---|---|---|
| Walter Mondale | 2,191 | 56.41 | |
| Gary Hart | 1,201 | 30.90 | |
| Jesse Jackson | 466 | 12.00 | |
| Thomas Eagleton | 18 | 0.46 | |
| George McGovern | 4 | 0.10 | |
| John Glenn | 2 | 0.05 | |
| Joe Biden | 1 | 0.03 | |
| Martha Kirkland | 1 | 0.03 | |
| Total votes | 3,884 | 100.00 | |
1988 edit
| Candidate | Votes | % | |
|---|---|---|---|
| Michael Dukakis | 2,877 | 70.09 | |
| Jesse Jackson | 1,219 | 29.70 | |
| Richard Stallings | 3 | 0.07 | |
| Joe Biden | 2 | 0.05 | |
| Dick Gephardt | 2 | 0.05 | |
| Lloyd Bentsen | 1 | 0.02 | |
| Gary Hart | 1 | 0.02 | |
| Total votes | 4,162 | 100.00 | |
Presidential elections (2008–2024) edit
2008 edit
New Hampshire primary edit
| Party | Candidate | Votes | % | |
|---|---|---|---|---|
| Democratic | Raymond Stebbins | 50,485 | 46.93 | |
| Democratic | William Bryk | 22,965 | 21.35 | |
| Democratic | John Edwards | 10,553 | 9.81 | |
| Democratic | Barack Obama | 6,402 | 5.95 | |
| Democratic | Bill Richardson | 5,525 | 5.14 | |
| Democratic | Hillary Clinton | 3,419 | 3.18 | |
| Democratic | Joe Biden | 1,512 | 1.41 | |
| Democratic | Al Gore | 966 | 0.90 | |
| Democratic | Dennis Kucinich | 762 | 0.71 | |
| Democratic | Bill Clinton | 388 | 0.36 | |
| Republican | John McCain | 293 | 0.27 | |
| Democratic | Christopher Dodd | 224 | 0.21 | |
| Republican | Ron Paul | 176 | 0.16 | |
| Republican | John Barnes Jr. | 95 | 0.09 | |
| Democratic | Mike Gravel | 91 | 0.09 | |
| Democratic | Joe Lieberman | 67 | 0.06 | |
| Republican | Mitt Romney | 66 | 0.06 | |
| Republican | Mike Huckabee | 63 | 0.06 | |
| Republican | Rudy Giuliani | 46 | 0.04 | |
| Democratic | Darrel Hunter | 20 | 0.02 | |
| Total votes | 104,118 | 100.00 | ||
Primaries edit
Excluding penalized contests,[19] only primary and caucuses votes:
| Candidate | Votes | % | |
|---|---|---|---|
| Barack Obama | 16,706,853 | 49.04 | |
| Hillary Clinton | 16,239,821 | 47.67 | |
| John Edwards | 742,010 | 2.18 | |
| Bill Richardson | 89,054 | 0.26 | |
| Uncommitted | 82,660 | 0.24 | |
| Dennis Kucinich | 68,482 | 0.20 | |
| Joe Biden | 64,041 | 0.19 | |
| Mike Gravel | 27,662 | 0.08 | |
| Christopher Dodd | 25,300 | 0.07 | |
| Others | 22,556 | 0.07 | |
| Total votes | 34,068,439 | 100.00 | |
Including penalized contests:
| Candidate | Votes | % | |
|---|---|---|---|
| Hillary Clinton | 18,225,175 | 48.03 | |
| Barack Obama | 17,988,182 | 47.41 | |
| John Edwards | 1,006,275 | 2.65 | |
| Uncommitted | 299,610 | 2.79 | |
| Bill Richardson | 106,073 | 0.28 | |
| Dennis Kucinich | 103,994 | 0.27 | |
| Joe Biden | 81,641 | 0.22 | |
| Scattering | 44,348 | 0.12 | |
| Mike Gravel | 40,251 | 0.11 | |
| Christopher Dodd | 35,281 | 0.09 | |
| Total votes | 37,980,830 | 100.00 | |
Nomination edit
| Party | Candidate | Votes | % | |
|---|---|---|---|---|
| Democratic | Joe Biden | –[a] | 100.00% | |
| Total votes | – | 100.00% | ||
General election edit

| Candidate | Running mate | Party | Popular vote | Electoral vote | |||
|---|---|---|---|---|---|---|---|
| Votes | % | Votes | % | ||||
| Barack Obama | Joe Biden | Democratic | 69,498,516 | 52.91 | 365 | 67.84 | |
| John McCain | Sarah Palin | Republican | 59,948,323 | 45.64 | 173 | 32.16 | |
| Ralph Nader | Matt Gonzalez | Independent | 739,034 | 0.56 | |||
| Bob Barr | Wayne Allyn Root | Libertarian | 523,715 | 0.40 | |||
| Chuck Baldwin | Darrell Castle | Constitution | 199,750 | 0.15 | |||
| Cynthia McKinney | Rosa Clemente | Green | 161,797 | 0.12 | |||
| Others | 290,626 | 0.22 | |||||
| Total | 131,361,761 | 100.00 | 538 | 100.00 | |||
| Source: [22] | |||||||
2012 edit
Nomination edit
| Party | Candidate | Votes | % | |
|---|---|---|---|---|
| Democratic | Joe Biden | –[a] | 100.00 | |
| Total votes | – | 100.00 | ||
General election edit

| Candidate | Running mate | Party | Popular vote | Electoral vote | |||
|---|---|---|---|---|---|---|---|
| Votes | % | Votes | % | ||||
| Barack Obama (inc.) | Joe Biden (inc.) | Democratic | 65,915,795 | 51.06 | 332 | 61.71 | |
| Mitt Romney | Paul Ryan | Republican | 60,933,504 | 47.20 | 206 | 38.29 | |
| Gary Johnson | Jim Gray | Libertarian | 1,275,971 | 0.99 | |||
| Jill Stein | Cheri Honkala | Green | 469,627 | 0.36 | |||
| Others | 490,513 | 0.38 | |||||
| Total | 129,085,410 | 100.00 | 538 | 100.00 | |||
| Source: [22] | |||||||
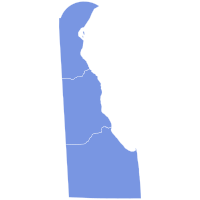
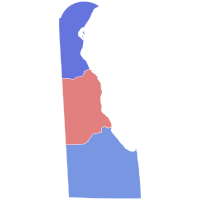
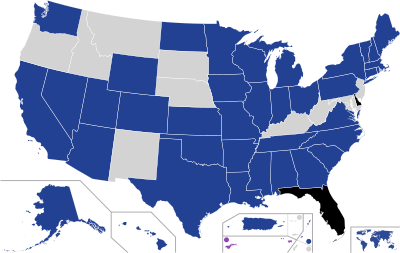
2020 edit
Primaries edit

| Joe Biden Bernie Sanders Michael Bloomberg |
| Candidate | Votes | % | |
|---|---|---|---|
| Joe Biden | 19,076,052 | 51.79 | |
| Bernie Sanders | 9,679,213 | 26.28 | |
| Elizabeth Warren | 2,831,472 | 7.69 | |
| Michael Bloomberg | 2,488,734 | 6.76 | |
| Pete Buttigieg | 924,237 | 2.51 | |
| Amy Klobuchar | 529,713 | 1.44 | |
| Tulsi Gabbard | 273,940 | 0.74 | |
| Tom Steyer | 259,792 | 0.71 | |
| Andrew Yang | 170,517 | 0.46 | |
| Uncommitted | 130,081 | 0.35 | |
| Michael Bennet | 63,124 | 0.17 | |
| Julian Castro | 37,037 | 0.10 | |
| Others | 370,044 | 1.01 | |
| Total votes | 36,833,956 | 100.00 | |
Nomination edit
| Candidate | Votes | % | |
|---|---|---|---|
| Joe Biden | 3,558 | 75.48 | |
| Bernie Sanders | 1,151 | 24.42 | |
| Abstention | 5 | 0.11 | |
| Total votes | 4,714 | 100.00 | |
General election edit

| Candidate | Running mate | Party | Popular vote | Electoral vote | |||
|---|---|---|---|---|---|---|---|
| Votes | % | Votes | % | ||||
| Joe Biden | Kamala Harris | Democratic | 81,268,924 | 51.31 | 306 | 56.88 | |
| Donald Trump (inc.) | Mike Pence (inc.) | Republican | 74,216,154 | 46.86 | 232 | 43.12 | |
| Jo Jorgensen | Spike Cohen | Libertarian | 1,865,724 | 1.18 | |||
| Howie Hawkins | Angela Walker | Green | 405,035 | 0.26 | |||
| Others | 628,584 | 0.40 | |||||
| Total | 158,384,421 | 100.00 | 538 | 100.00 | |||
| Source: [26] | |||||||
2024 edit
Primaries edit
| Candidate | Votes | % | |
|---|---|---|---|
| Joe Biden (incumbent) | 10,116,916 | 86.84 | |
| Uncommitted | 459,331 | 3.94 | |
| Dean Phillips | 391,377 | 3.36 | |
| Marianne Williamson | 381,154 | 3.27 | |
| Armando Perez-Serrato | 76,244 | 0.65 | |
| Gabriel Cornejo | 69,701 | 0.60 | |
| Frank Lozada | 36,571 | 0.31 | |
| Stephen Lyons | 34,378 | 0.30 | |
| President R. Boddie | 24,773 | 0.21 | |
| Cenk Uygur | 20,546 | 0.18 | |
| Eban Cambridge | 12,645 | 0.11 | |
| Others | 26,484 | 0.23 | |
| Total votes | 11,650,120 | 100.00 | |
See also edit
- Electoral history of Kamala Harris
- Electoral history of Barack Obama
- Electoral history of Hillary Clinton
- Electoral history of Sarah Palin
- Electoral history of John McCain
- Electoral history of John Edwards
- Electoral history of Bill Richardson
- Electoral history of Mike Gravel
- Electoral history of Christopher Dodd
- Electoral history of Paul Ryan
- Electoral history of Mitt Romney
Notes edit
References edit
- ^ "Biden and Harris inauguration live: Joe Biden becomes the 46th US president". BBC News. 20 January 2021. Retrieved 2021-01-20.
- ^ Saenz, Arlette (April 25, 2019). "Joe Biden announces he is running for president in 2020". CNN. Archived from the original on April 25, 2019. Retrieved April 25, 2019.
- ^ Burns, Alexander; Flegenheimer, Matt; Lee, Jasmine C.; Lerer, Lisa; Martin, Jonathan (January 10, 2020). "Who's Running for President in 2020?". The New York Times. ISSN 0362-4331. Retrieved January 22, 2020.
- ^ Korecki, Natasha (March 2, 2020). "How Biden engineered his astonishing comeback". Politico. Retrieved October 22, 2020.
- ^ Ember, Sydney (April 8, 2020). "Bernie Sanders Is Dropping Out of 2020 Democratic Race for President". The New York Times. ISSN 0362-4331. Retrieved April 8, 2020.
- ^ Detrow, Scott (June 5, 2020). "Biden Formally Clinches Democratic Nomination, While Gaining Steam Against Trump". NPR. Retrieved June 5, 2020.
The AP delegate estimate reached the magic number of 1,991 delegates for Biden as seven states and the District of Columbia continue counting votes from Tuesday's primaries
- ^ Lewis, Sophie (November 7, 2020). "Joe Biden breaks Obama's record for most votes ever cast for a U.S presidential candidate". CBS.
- ^ "State of Delaware Official Results of General Election (Excluding Write-in Votes) 1970" (PDF). Office of the Delaware State Election Commissioner. Archived from the original (PDF) on 2021-02-17. Retrieved 2020-04-28.
- ^ Clerk of the United States House of Representatives (1973). "Statistics of the Presidential and Congressional Election of November 7, 1972" (PDF). U.S. Government Printing Office.
- ^ Clerk of the United States House of Representatives (1979). "Statistics of the Presidential and Congressional Election of November 7, 1978" (PDF). U.S. Government Printing Office.
- ^ Clerk of the United States House of Representatives (1985). "Statistics of the Presidential and Congressional Election of November 6, 1984" (PDF). U.S. Government Printing Office.
- ^ Clerk of the United States House of Representatives (1991). "Statistics of the Congressional Election of November 6, 1990" (PDF). U.S. Government Printing Office.
- ^ Clerk of the United States House of Representatives (1997). "Statistics of the Presidential and Congressional Election of November 5, 1996" (PDF). U.S. Government Printing Office.
- ^ Clerk of the United States House of Representatives (2003). "Statistics of the Congressional Election of November 5, 2002" (PDF). U.S. Government Printing Office.
- ^ Clerk of the United States House of Representatives (2009). "Statistics of the Congressional Election of November 4, 2008" (PDF). U.S. Government Printing Office.
- ^ Our Campaigns - US President - D Convention Race - Jul 16, 1984
- ^ "Democrats Acclaim Dukakis and Assert Unity". partners.nytimes.com. Retrieved April 4, 2013.
- ^ "Presidential Primary Election January 8". Sos.nh.gov. 2008-01-08. Archived from the original on 2012-04-27. Retrieved 2012-01-04.
- ^ Florida and Michigan violated Democratic National Committee rules by moving their primaries before February 5, 2008, resulting in a nullification of their primaries, until the DNC Rules and Bylaws Committee voted to restore half their delegates.
- ^ a b "2008 Democratic Popular Vote". RealClearPolitics. Retrieved February 15, 2020.
- ^ "CNN.com Video". CNN. Retrieved May 1, 2010.
- ^ a b "Federal Elections 2012" (PDF). Federal Election Commission. Washington, D.C. 2013. Retrieved January 20, 2021.
- ^ "Beau Biden Speech Kicks Of Motion To Nominate Father Joe Biden For Vice President". The Huffington Post. September 6, 2012.
- ^ "Democratic Convention - Nationwide Popular Vote". The Green Papers. Retrieved March 19, 2020.
- ^ "The Math Behind the Democratic Delegate Allocation - 2020". The Green Papers. Retrieved January 4, 2020.
- ^ "Official 2020 presidential general election results" (PDF). Federal Election Commission. 1 February 2021. Retrieved 6 February 2021.
- ^ "Democratic Convention - Nationwide Popular Vote". The Green Papers. Retrieved March 28, 2024.