


Summary
California's 47th congressional district is a congressional district in the U.S. state of California.
| California's 47th congressional district | |||
|---|---|---|---|
Interactive map of district boundaries since January 3, 2023 | |||
| Representative |
| ||
| Population (2022) | 752,940 | ||
| Median household income | $117,944[1] | ||
| Ethnicity |
| ||
| Cook PVI | D+3[2] | ||
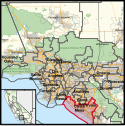

Following the 2020 redistricting cycle, the district shifted to Orange County to contain Irvine, Huntington Beach, Costa Mesa, Newport Beach and Seal Beach. It is currently represented by Democrat Katie Porter.
Competitiveness edit
The district, a Democratic-leaning swing district with a Cook Partisan Voting Index of D+3, includes the heavily Democratic city of Irvine, and Republican-leaning coastal cities such as Huntington Beach and Newport Beach.
In statewide races edit
Notes edit
Composition edit
| # | County | Seat | Population |
|---|---|---|---|
| 59 | Orange | Santa Ana | 3,167,809 |
As of the 2020 redistricting, California's 38th congressional district is located in Southern California. It covers the South Coast Metro area of Orange County.
Orange County is split between this district, the 45th district, the 46th district, the 40th district, and the 49th district. The 47th, 45th and 46th are partitioned by Highway 405, Old Ranch Parkway, Seal Beach Blvd, St Cloud Dr, Montecito Rd, Rossmoor Center Way, 12240 Seal Beach Blvd-Los Alamitos Army Airfield, Bolsa Chica Channel, Rancho Rd, Harold Pl, Springdale St, 6021 Anacapa Dr-Willow Ln, Edward St, Bolsa Ave, Goldenwest St, McFadden Ave, Union Pacific Railroad, 15241 Cascade Ln-15241 Cedarwood Ave, Highway 39, Edinger Ave, Newland St, Heil Ave, Magnolia St, Warner Ave, Garfield Ave, the Santa Ana River, MacArthur Blvd, Harbor Blvd, Sunflower Ave, Costa Mesa Freeway, E Alton Parkway, and Red Hill Ave.
The 47th, 40th and 49th are partitioned by Barranca Parkway, Jamboree Rd, Warner Ave, Harvard Ave, Myford Rd, Highway 5, Loma Ridge Nature Preserve, Bee Canyon Access Rd, Portola Parkway, Highway 133, Highway 241, Bake Parkway, San Diego Freeway, Ridge Route Dr, Moulton Parkway, Santa Maria Ave, Via Vista, Alta Vis, Santa Vittoria Dr, Avenida del Sol, Punta Alta, Galle Azul, Bahia Blanca W, Laguna Coast Wilderness Park, Highway S18, Aliso & Wood Canyons, Vista del Sol, Highway 1, Stonington Rd, Virginia Way, 7th Ave, and Laguna Beach.
The 47th district takes in the cities of Costa Mesa, Irvine, Seal Beach, Huntington Beach, Newport Beach, and Laguna Beach.
Cities & CDP with 10,000 or more edit
- Irvine - 307,670
- Huntington Beach - 198,711
- Costa Mesa - 111,918
- Newport Beach - 85,239
- Seal Beach - 25,242
- Laguna Beach - 23,032
List of members representing the district edit


Election results edit
1992 edit
| Party | Candidate | Votes | % | |
|---|---|---|---|---|
| Republican | Chris Cox (Incumbent) | 165,004 | 64.9 | |
| Democratic | John F. Anwiler | 76,924 | 30.3 | |
| Peace and Freedom | Maxine Bell Quirk | 12,297 | 4.8 | |
| Independent | Barry Charles (write-in) | 32 | 0.0 | |
| Total votes | 244,257 | 100.0 | ||
| Republican hold | ||||
1994 edit
| Party | Candidate | Votes | % | |
|---|---|---|---|---|
| Republican | Chris Cox (Incumbent) | 154,071 | 71.7 | |
| Democratic | Gary Kingsbury | 53,669 | 25.0 | |
| Libertarian | Victor A. Wagner, Jr. | 7,257 | 3.3 | |
| Total votes | 214,997 | 100.0 | ||
| Republican hold | ||||
1996 edit
| Party | Candidate | Votes | % | |
|---|---|---|---|---|
| Republican | Chris Cox (Incumbent) | 160,078 | 65.7 | |
| Democratic | Tina Laine | 70,362 | 28.9 | |
| Natural Law | Iris Adam | 6,573 | 2.8 | |
| Libertarian | Victor Wagner | 6,530 | 2.6 | |
| Total votes | 243,777 | 100.0 | ||
| Republican hold | ||||
1998 edit
| Party | Candidate | Votes | % | |
|---|---|---|---|---|
| Republican | Chris Cox (Incumbent) | 132,711 | 67.6 | |
| Democratic | Christina Avalos | 57,938 | 29.5 | |
| Libertarian | Victor A. Wagner, Jr. | 2,991 | 1.5 | |
| Reform | Raymond O. Mills | 1,369 | 0.7 | |
| Natural Law | Paul Fisher | 1,307 | 0.7 | |
| Total votes | 196,316 | 100.0 | ||
| Republican hold | ||||
2000 edit
| Party | Candidate | Votes | % | |
|---|---|---|---|---|
| Republican | Chris Cox (Incumbent) | 181,365 | 65.7 | |
| Democratic | John Graham | 83,186 | 30.1 | |
| Libertarian | David F. Nolan | 8,081 | 2.9 | |
| Natural Law | Iris Adam | 3,769 | 1.3 | |
| Total votes | 276,401 | 100.0 | ||
| Republican hold | ||||
2002 edit
| Party | Candidate | Votes | % | |
|---|---|---|---|---|
| Democratic | Loretta Sanchez (Incumbent) | 42,501 | 60.6 | |
| Republican | Jeff Chavez | 24,346 | 34.7 | |
| Libertarian | Paul Marsden | 2,944 | 4.2 | |
| Independent | Kenneth M. Valenzuela-Fisher (write-in) | 382 | 0.5 | |
| Independent | Michael J. Monge (write-in) | 5 | 0.0 | |
| Total votes | 70,178 | 100.0 | ||
| Democratic hold | ||||
2004 edit
| Party | Candidate | Votes | % | |
|---|---|---|---|---|
| Democratic | Loretta Sanchez (Incumbent) | 65,684 | 60.4 | |
| Republican | Alexandria A. "Alex" Coronado | 43,099 | 39.6 | |
| Total votes | 108,783 | 100.0 | ||
| Democratic hold | ||||
2006 edit
| Party | Candidate | Votes | % | |
|---|---|---|---|---|
| Democratic | Loretta Sanchez (Incumbent) | 47,134 | 62.4 | |
| Republican | Tan D. Nguyen | 28,485 | 37.6 | |
| Total votes | 75,619 | 100.0 | ||
| Democratic hold | ||||
2008 edit
| Party | Candidate | Votes | % | |
|---|---|---|---|---|
| Democratic | Loretta Sanchez (Incumbent) | 85,878 | 69.5 | |
| Republican | Rosemarie "Rosie" Avila | 31,432 | 25.4 | |
| American Independent | Robert Lauten | 6,274 | 5.1 | |
| Total votes | 123,584 | 100.0 | ||
| Democratic hold | ||||
2010 edit
| Party | Candidate | Votes | % | |
|---|---|---|---|---|
| Democratic | Loretta Sanchez (Incumbent) | 50,832 | 53.0 | |
| Republican | Van Tran | 37,679 | 39.3 | |
| Independent | Cecilia Igleseis | 7,443 | 7.7 | |
| Total votes | 95,954 | 100.0 | ||
| Democratic hold | ||||
2012 edit
| Party | Candidate | Votes | % | |
|---|---|---|---|---|
| Democratic | Alan Lowenthal | 130,093 | 56.6 | |
| Republican | Gary DeLong | 99,919 | 43.4 | |
| Total votes | 230,012 | 100.0 | ||
| Democratic hold | ||||
2014 edit
| Party | Candidate | Votes | % | |
|---|---|---|---|---|
| Democratic | Alan Lowenthal (Incumbent) | 69,061 | 56.0 | |
| Republican | Andy Whallon | 54,309 | 44.0 | |
| Total votes | 123,370 | 100.0 | ||
| Democratic hold | ||||
2016 edit
| Party | Candidate | Votes | % | |
|---|---|---|---|---|
| Democratic | Alan Lowenthal (Incumbent) | 154,759 | 63.7 | |
| Republican | Andy Whallon | 88,109 | 36.3 | |
| Total votes | 242,868 | 100.0 | ||
| Democratic hold | ||||
2018 edit
| Party | Candidate | Votes | % | |
|---|---|---|---|---|
| Democratic | Alan Lowenthal (Incumbent) | 143,354 | 64.9 | |
| Republican | John Briscoe | 77,682 | 35.1 | |
| Total votes | 221,036 | 100.0 | ||
| Democratic hold | ||||
2020 edit
| Party | Candidate | Votes | % | |
|---|---|---|---|---|
| Democratic | Alan Lowenthal (incumbent) | 197,028 | 63.3 | |
| Republican | John Briscoe | 114,371 | 36.7 | |
| Total votes | 311,399 | 100.0 | ||
| Democratic hold | ||||
2022 edit
| Party | Candidate | Votes | % | |
|---|---|---|---|---|
| Democratic | Katie Porter (Incumbent) | 137,374 | 51.7 | |
| Republican | Scott Baugh | 128,261 | 48.3 | |
| Total votes | 265,635 | 100.0 | ||
| Democratic hold | ||||
Historical district boundaries edit
2003-13 edit
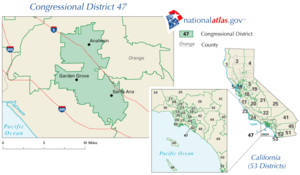
From 2003 through 2013, the district included many of Orange County's central suburbs, including Anaheim, Garden Grove and Santa Ana.
2013-23 edit

Due to redistricting after the 2010 United States census, the district moved west to parts of Los Angeles County and included Catalina and San Clemente islands. The district also retained parts of Orange County such as Garden Grove.
In popular culture edit
California's 47th congressional district was the scene of a congressional election (won by a deceased Democrat), and later a congressional special election (won by the Republican incumbent), featured in several episodes of the political drama The West Wing. Like the real district, the fictional one from the show is in Orange County.[55]
See also edit
References edit
- ^ Center for New Media & Promotion (CNMP), US Census Bureau. "My Congressional District". www.census.gov. Retrieved February 19, 2024.
- ^ "2022 Cook PVI: District Map and List". The Cook Political Report. July 12, 2022. Retrieved January 10, 2022.
- ^ Statement of Vote (1992 President)
- ^ a b Statement of Vote (1992 Senator)
- ^ Statement of Vote (1994 Governor)
- ^ Statement of Vote (1994 Senator)
- ^ Statement of Vote (1996 President)
- ^ "Statement of Vote (1998 Governor)" (PDF). Archived from the original (PDF) on September 29, 2011.
- ^ "Statement of Vote (1998 Senator)" (PDF). Archived from the original (PDF) on September 29, 2011.
- ^ Statement of Vote (2000 President)
- ^ Statement of Vote (2000 Senator)
- ^ Statement of Vote (2002 Governor)
- ^ Statement of Vote (2003 Recall Question)
- ^ Statement of Vote (2003 Governor)
- ^ Statement of Vote (2004 President)
- ^ Statement of Vote (2004 Senator)
- ^ Statement of Vote (2006 Governor)
- ^ Statement of Vote (2006 Senator)
- ^ Statement of Vote (2008 President)
- ^ Statement of Vote (2010 Governor)
- ^ Statement of Vote (2010 Senator)
- ^ Statement of Vote (2012 President)
- ^ Statement of Vote (2012 Senator)
- ^ Statement of Vote (2014 Governor)
- ^ Statement of Vote (2016 President)
- ^ Statement of Vote (2016 Senator)
- ^ Statement of Vote (2018 Governor)
- ^ a b c d e f g Orange County Elections
- ^ a b c d e f g Los Angeles Elections
- ^ Statement of Vote (2018 Senator)
- ^ Statement of Vote (2020 President)
- ^ "Counties by Congressional District for Recall Question" (PDF). sos.ca.gov. September 14, 2021. Retrieved May 2, 2022.
- ^ "Counties by Congressional Districts for Governor" (PDF). sos.ca.gov. November 8, 2022. Retrieved May 4, 2023.
- ^ Statement of Vote (2022 Senator)
- ^ Statement of Vote (2022 Senator)
- ^ a b "Biographical Directory of the United States Congress 1774–2005" (PDF). govinfo.gov. Retrieved February 19, 2024.
- ^ Nominations clerk.house.gov
- ^ Washington, U. S. Capitol Room H154; p:225-7000, DC 20515-6601. "Katie Porter (California (CA)), 118th Congress Profile". Office of the Clerk, U.S. House of Representatives. Retrieved January 18, 2024.
{{cite web}}: CS1 maint: numeric names: authors list (link) - ^ 1992 election results
- ^ 1994 election results
- ^ 1996 election results
- ^ 1998 election results
- ^ 2000 election results
- ^ 2002 election results
- ^ 2004 election results
- ^ 2006 election results
- ^ 2008 election results
- ^ 2010 election results
- ^ 2012 election results
- ^ 2014 election results
- ^ 2016 election results
- ^ 2018 election results
- ^ 2020 election results
- ^ 2022 election results
- ^ "Reel Life Blurs Reality in O.C." LA Times. January 19, 2003. Retrieved November 4, 2022.
External links edit
- GovTrack.us: California's 47th congressional district
- RAND California Election Returns: District Definitions
- California Voter Foundation map - CD47
33°46′59″N 117°53′57″W / 33.783024°N 117.899206°W