


Summary
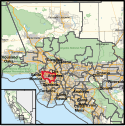
California's 37th congressional district is a congressional district in the U.S. state of California based in Los Angeles County. It includes many neighborhoods west and southwest of Downtown Los Angeles.
| California's 37th congressional district | |||
|---|---|---|---|
Interactive map of district boundaries since January 3, 2023 | |||
| Representative |
| ||
| Population (2022) | 740,416[1] | ||
| Median household income | $64,565[1] | ||
| Ethnicity |
| ||
| Cook PVI | D+37[2] | ||

The district includes
- Culver City
- Ladera Heights
- View Point-Windsor Hills
- the City of Los Angeles neighborhoods of Mid City, Century City, Beverlywood, View Park-Windsor Hills, South Robertson, Exposition Park, University Park, Vermont Knolls, West Adams, Leimert Park, Jefferson Park, Vermont Square, Ladera Heights, Hyde Park, Crenshaw, and Baldwin Hills.
The district is highly diverse ethnically. Approximately 40% of the district's residents are Hispanic, while African Americans and whites make up nearly a quarter each.
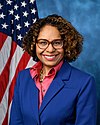
The district is currently represented by Democrat Sydney Kamlager-Dove; she was elected to the seat in the 2022 midterm elections and took office on January 3, 2023.
Recent results in statewide elections edit
| Election results from statewide races | ||
|---|---|---|
| Year | Office | Results |
| 1990 | Governor[3] | Wilson 58.4% - 36.5% |
| 1992 | President[4] | Clinton 73.8% - 15.7% |
| Senator[5] | Boxer 70.9% - 21.4% | |
| Senator (Special)[6] | Feinstein 75.7% - 17.7% | |
| 1994 | Governor[7] | Brown 64.3% - 31.8% |
| Senator[8] | Feinstein 66.6% - 24.4% | |
| 1996 | President[9] | Clinton 81.5% - 12.7% |
| 1998 | Governor[10] | Davis 84.2% - 13.1% |
| Senator[11] | Boxer 80.7% – 16.0% | |
| 2000 | President[12] | Gore 82.8% - 14.8% |
| Senator[13] | Feinstein 82.8% - 11.8% | |
| 2002 | Governor[14] | Davis 67.7% - 23.6% |
| 2003 | Recall[15][16] | |
| Bustamante 44.3% - 36.7% | ||
| 2004 | President[17] | Kerry 73.5% - 25.2% |
| Senator[18] | Boxer 76.3% - 18.1% | |
| 2006 | Governor[19] | Angelides 60.6% - 33.9% |
| Senator[20] | Feinstein 76.6% - 18.0% | |
| 2008 | President[21] | Obama 79.6% - 18.7% |
| 2010 | Governor[22] | Brown 74.1% - 20.3% |
| Senator[23] | Boxer 73.7% - 20.5% | |
| 2012 | President[24] | Obama 84.9% - 12.7% |
| Senator[25] | Feinstein 86.1% – 13.9% | |
| 2014 | Governor[26] | Brown 84.3% – 15.7% |
| 2016 | President[27] | Clinton 85.7% - 9.6% |
| Senator[28] | Harris 74.3% – 25.7% | |
| 2018 | Governor[29] | Newsom 86.3% – 13.7% |
| Senator[30] | Feinstein 53.7% – 46.3% | |
| 2020 | President[31] | Biden 84.3% - 13.8% |
| 2021 | Recall[32] | |
| 2022 | Governor[33] | Newsom 85.0 - 15.0% |
| Senator | Padilla 86.4 - 13.6% | |
Composition edit
| # | County | Seat | Population |
|---|---|---|---|
| 37 | Los Angeles | Los Angeles | 9,829,544 |
As of the 2020 redistricting, California's 37th congressional district is located in the South Los Angeles region.
Los Angeles County is split between this district, the 30th district, the 34th district, the 36th district, the 42nd district, and the 43rd district. The 37th, 30th and 36th are partitioned by Phyllis Ave, N Doheny Dr, N Oakhurst Dr, Burton Way, N Robertson Blvd, 8733 Clifton Way-201 S Le Doux Rd, N San Vicente Blvd, La Cienga Park, S Le Doux Rd, Gregory Way, S Robertson Blvd, Whitworth Dr, Beverly Green Dr, 1271 Beverly Green Dr-1333 Beverly Green Dr, Heath Ave, S Moreno Dr, Highway 2, Century Park W, W Pico Blvd, Patricia Ave, Lorenzo Pl, Monte Mar Dr, Beverwill Dr, Castle Heights Ave, Club Dr, McConnell Dr, National Blvd, Palms Blvd, Overland Ave, Venice Blvd, Highway 405, W Havelock Ave, S St Nicholas Ave, Ballona Creek, and Centinela Creek Channel.
The 37th, 34th and 42nd are partitioned by Crenshaw Blvd, W Pico Blvd, S Normandie Ave, Highway 10, Harbor Freeway, E 7th St, S Alameda St, S Alameda St, E Slauson Ave, S Central Ave, Firestone Blvd-E 90 St.
The 37th and 43rd are partitioned by E 91st St, McKinley Ave, E 88th Pl, Avalon Blvd, E Manchester Ave, S Normandie Ave, W 94th Pl, S Halldale Ave, W Century Blvd, La Salle Ave/S Denker Ave, W 104th St, S Western Ave, W 108th St, S Gramercy Pl, S Van Ness Ave, W 76th St, 8th Ave, W 79th St, S Victoria Ave, W 74th St, West Blvd, W 64th St, S La Brea Ave, 6231 S La Brea Ave-Flight Ave, W 64th St, 6404 S Springpark Ave-W Fairview Blvd, and W Centinela Ave.
The 37th district take in the city of Culver City, and the Los Angeles neighborhoods of Jefferson Park, Hyde Park, Ladera, and the north side of Century City.
Cities & CDP with 10,000 or more people edit
- Los Angeles - 3,898,747
- Inglewood - 107,762
- Culver City - 40,779
List of members representing the district edit


Election results edit
|
1962 • 1964 • 1966 • 1968 • 1970 • 1972 • 1974 • 1975 (Special) • 1976 • 1978 • 1980 • 1982 • 1984 • 1986 • 1988 • 1990 • 1992 • 1994 • 1996 (Special) • 1996 • 1998 • 2000 • 2002 • 2004 • 2006 • 2007 (Special) • 2008 • 2010 • 2012 • 2014 • 2016 • 2018 • 2020 • 2022 |
1962 edit
| Party | Candidate | Votes | % | ||
|---|---|---|---|---|---|
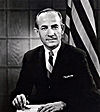
| Democratic | Lionel Van Deerlin (Incumbent) | 63,821 | 51.4 | ||
| Republican | Dick Wilson | 60,460 | 48.6 | ||
| Total votes | 124,281 | 100.0 | |||
| Democratic win (new seat) | |||||
1964 edit
| Party | Candidate | Votes | % | |
|---|---|---|---|---|
| Democratic | Lionel Van Deerlin (Incumbent) | 85,624 | 58.2 | |
| Republican | Dick Wilson | 61,373 | 41.8 | |
| Total votes | 146,997 | 100.0 | ||
| Democratic hold | ||||
1966 edit
| Party | Candidate | Votes | % | |
|---|---|---|---|---|
| Democratic | Lionel Van Deerlin (Incumbent) | 80,060 | 61.2 | |
| Republican | Samuel S. Vener | 50,817 | 38.8 | |
| Total votes | 130,877 | 100.0 | ||
| Democratic hold | ||||
1968 edit
| Party | Candidate | Votes | % | |
|---|---|---|---|---|
| Democratic | Lionel Van Deerlin (Incumbent) | 95,591 | 64.7 | |
| Republican | Mike Schaefer | 52,212 | 35.3 | |
| Total votes | 147,803 | 100.0 | ||
| Democratic hold | ||||
1970 edit
| Party | Candidate | Votes | % | |
|---|---|---|---|---|
| Democratic | Lionel Van Deerlin (Incumbent) | 93,952 | 72.1 | |
| Republican | James B. Kuhn | 31,968 | 24.5 | |
| American Independent | Faye B. Brice | 2,962 | 2.3 | |
| Peace and Freedom | Fritjof Thygeson | 1,386 | 1.1 | |
| Total votes | 130,268 | 100.0 | ||
| Democratic hold | ||||
1972 edit
| Party | Candidate | Votes | % | |
|---|---|---|---|---|
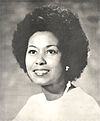
| Democratic | Yvonne Brathwaite Burke | 120,392 | 73.2 | |
| Republican | Greg Tria | 40,633 | 24.7 | |
| Peace and Freedom | John Hagg | 3,485 | 2.1 | |
| Total votes | 164,510 | 100.0 | ||
| Democratic hold | ||||
1974 edit
| Party | Candidate | Votes | % | |
|---|---|---|---|---|
| Republican | Jerry Pettis (Incumbent) | 88,548 | 63.2 | |
| Democratic | Bobby Ray Vincent | 46,449 | 32.9 | |
| American Independent | John H. Ortman | 5,522 | 3.9 | |
| Total votes | 140,519 | 100.0 | ||
| Republican hold | ||||
1975 (Special) edit
| Party | Candidate | Votes | % | |
|---|---|---|---|---|
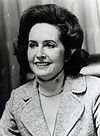
| Republican | Shirley Neil Pettis | 53,165 | 60.5 | |
| Democratic | Ron Pettis | 12,940 | 14.7 | |
| Democratic | James L. Mayfield | 11,140 | 12.7 | |
| Republican | Frank M. Bogert | 4,773 | 5.4 | |
| American Independent | Bernard Wahl | 1,378 | 1.6 | |
| Democratic | Joe E. Hubbs, Sr. | 1,104 | 1.3 | |
| Republican | Louis Martinez | 871 | 1.0 | |
| Republican | Jack H. Harrison | 688 | 0.8 | |
| Republican | Bud Mathewson | 555 | 0.6 | |
| Democratic | Clodeon Speed Adkins | 488 | 0.6 | |
| Democratic | C. L. "Jimmie" James | 308 | 0.3 | |
| Democratic | Richard "Doc" Welby | 291 | 0.3 | |
| Republican | Robert J. Allenthorp | 181 | 0.2 | |
| Total votes | 88,882 | 100.0 | ||
| Republican hold | ||||
1976 edit
| Party | Candidate | Votes | % | |
|---|---|---|---|---|
| Republican | Shirley Neil Pettis (Incumbent) | 133,634 | 71.1 | |
| Democratic | Douglas C. Nilson Jr. | 49,021 | 26.1 | |
| American Independent | Bernard Wahl | 5,352 | 2.8 | |
| Total votes | 188,007 | 100.0 | ||
| Republican hold | ||||
1978 edit
| Party | Candidate | Votes | % | |
|---|---|---|---|---|
| Republican | Jerry Lewis | 106,581 | 61.4 | |
| Democratic | Dan Corcoran | 60,463 | 34.8 | |
| American Independent | Bernard Wahl | 6,544 | 3.8 | |
| Total votes | 173,588 | 100.0 | ||
| Republican hold | ||||
1980 edit
| Party | Candidate | Votes | % | |
|---|---|---|---|---|
| Republican | Jerry Lewis (Incumbent) | 165,371 | 71.6 | |
| Democratic | Donald M. "Don" Rusk | 58,091 | 25.1 | |
| Libertarian | Larry Morris | 7,615 | 3.3 | |
| Total votes | 231,077 | 100.0 | ||
| Republican hold | ||||
1982 edit
| Party | Candidate | Votes | % | |
|---|---|---|---|---|
| Republican | Al McCandless | 105,065 | 59.1 | |
| Democratic | Curtis R. "Sam" Cross | 68,510 | 38.5 | |
| Libertarian | Marc R. Wruble | 4,297 | 2.4 | |
| Total votes | 177,872 | 100.0 | ||
| Republican hold | ||||
1984 edit
| Party | Candidate | Votes | % | |
|---|---|---|---|---|
| Republican | Al McCandless (Incumbent) | 149,955 | 63.6 | |
| Democratic | David E. "Dave" Skinner | 85,908 | 36.4 | |
| Total votes | 245,863 | 100.0 | ||
| Republican hold | ||||
1986 edit
| Party | Candidate | Votes | % | |
|---|---|---|---|---|
| Republican | Al McCandless (Incumbent) | 122,416 | 63.7 | |
| Democratic | David E. "Dave" Skinner | 69,808 | 36.3 | |
| Total votes | 192,224 | 100.0 | ||
| Republican hold | ||||
1988 edit
| Party | Candidate | Votes | % | |
|---|---|---|---|---|
| Republican | Al McCandless (Incumbent) | 174,284 | 64.3 | |
| Democratic | Johnny Pearson | 89,666 | 33.1 | |
| Libertarian | Bonnie Flickinger | 7,169 | 2.6 | |
| Independent | Write-ins | 123 | 0.0 | |
| Total votes | 271,242 | 100.0 | ||
| Republican hold | ||||
1990 edit
| Party | Candidate | Votes | % | |
|---|---|---|---|---|
| Republican | Al McCandless (Incumbent) | 115,469 | 49.7 | |
| Democratic | Ralph Waite | 103,961 | 44.8 | |
| American Independent | Gary R. Odom | 6,474 | 2.8 | |
| Libertarian | Bonnie Flickinger | 6,178 | 2.7 | |
| Total votes | 232,082 | 100.0 | ||
| Republican hold | ||||
1992 edit
| Party | Candidate | Votes | % | |
|---|---|---|---|---|
| Democratic | Walter R. Tucker III (Incumbent) | 97,159 | 85.7 | |
| Peace and Freedom | B. Kwaku Duren | 16,178 | 14.3 | |
| Total votes | 113,337 | 100.0 | ||
| Democratic hold | ||||
1994 edit
| Party | Candidate | Votes | % | |
|---|---|---|---|---|
| Democratic | Walter R. Tucker III (Incumbent) | 64,166 | 77.4 | |
| Libertarian | Guy Wilson | 18,502 | 22.3 | |
| Independent | Lewis B Prulitsky (write-in) | 263 | 0.3 | |
| Total votes | 82,931 | 100.0 | ||
| Democratic hold | ||||
1996 (Special) edit
| Party | Candidate | Votes | % | |
|---|---|---|---|---|
| Democratic | Juanita Millender-McDonald | 13,868 | 27.3 | |
| Democratic | Willard H. Murray, Jr. | 10,396 | 20.4 | |
| Democratic | Omar Bradley | 6,975 | 13.7 | |
| Democratic | Paul H. Richards | 6,035 | 11.9 | |
| Democratic | Robert M. Saucedo | 4,495 | 8.8 | |
| Democratic | Charles Davis | 2,555 | 5.0 | |
| Democratic | Murry J. Carter | 1,574 | 3.1 | |
| Democratic | Joyce Harris | 1,322 | 2.6 | |
| Democratic | Robin Tucker | 3,661 | 1.0 | |
| Total votes | 62,344 | 100.0 | ||
| Turnout | {{{votes}}} | 30.9 | ||
| Democratic hold | ||||
1996 edit
| Party | Candidate | Votes | % | |
|---|---|---|---|---|
| Democratic | Juanita Millender-McDonald (Incumbent) | 87,247 | 85.0 | |
| Republican | Michael Voetee | 15,339 | 15.0 | |
| Total votes | 102,586 | 100.0 | ||
| Democratic hold | ||||
1998 edit
| Party | Candidate | Votes | % | |
|---|---|---|---|---|
| Democratic | Juanita Millender-McDonald (Incumbent) | 70,026 | 85.1 | |
| Republican | Saul E. Lankster | 12,301 | 14.9 | |
| Total votes | 82,327 | 100.0 | ||
| Democratic hold | ||||
2000 edit
| Party | Candidate | Votes | % | |
|---|---|---|---|---|
| Democratic | Juanita Millender-McDonald (Incumbent) | 93,269 | 82.4 | |
| Republican | Vernon Van | 12,762 | 11.3 | |
| Natural Law | Margaret Glazer | 4,094 | 3.6 | |
| Libertarian | Herb Peters | 3,150 | 2.7 | |
| Total votes | 113,275 | 100.0 | ||
| Democratic hold | ||||
2002 edit
| Party | Candidate | Votes | % | |
|---|---|---|---|---|
| Democratic | Juanita Millender-McDonald (Incumbent) | 63,445 | 73.0 | |
| Republican | Oscar A. Velasco | 20,154 | 23.1 | |
| Libertarian | Herb Peters | 3,413 | 3.9 | |
| Total votes | 87,012 | 100.0 | ||
| Democratic hold | ||||
2004 edit
| Party | Candidate | Votes | % | |
|---|---|---|---|---|
| Democratic | Juanita Millender-McDonald (Incumbent) | 118,823 | 75.1 | |
| Republican | Vernon Van | 31,960 | 20.2 | |
| Libertarian | Herb Peters | 7,535 | 4.7 | |
| Total votes | 158,318 | 100.0 | ||
| Democratic hold | ||||
2006 edit
| Party | Candidate | Votes | % | |
|---|---|---|---|---|
| Democratic | Juanita Millender-McDonald (Incumbent) | 80,716 | 82.4 | |
| Libertarian | Herb Peters | 17,246 | 17.6 | |
| Total votes | 97,962 | 100.0 | ||
| Democratic hold | ||||
2007 (Special) edit
| Party | Candidate | Votes | % | |
|---|---|---|---|---|
| Democratic | Laura Richardson | 15,559 | 67.0 | |
| Republican | John Kanaley | 5,837 | 25.2 | |
| Green | Daniel Brezenoff | 1,274 | 5.5 | |
| Libertarian | Herb Peters | 538 | 2.3 | |
| Independent | Lee Davis (write-in) | 12 | 0.0 | |
| Independent | Christoper Remple (write-in) | 1 | 0.0 | |
| Total votes | 23,221 | 100.0 | ||
| Turnout | {{{votes}}} | 8.6 | ||
| Democratic hold | ||||
2008 edit
| Party | Candidate | Votes | % | |
|---|---|---|---|---|
| Democratic | Laura Richardson (Incumbent) | 131,342 | 74.9 | |
| Independent | Nick Dibs | 42,774 | 25.1 | |
| Total votes | 175,252 | 100.0 | ||
| Democratic hold | ||||
2010 edit
| Party | Candidate | Votes | % | |
|---|---|---|---|---|
| Democratic | Laura Richardson (Incumbent) | 85,799 | 68.4 | |
| Republican | Star Parker | 29,159 | 23.2 | |
| Independent | Nicholas Dibs | 10,560 | 8.4 | |
| Total votes | 125,518 | 100.0 | ||
| Democratic hold | ||||
2012 edit
| Party | Candidate | Votes | % | |
|---|---|---|---|---|
| Democratic | Karen Bass (Incumbent) | 207,039 | 86.4 | |
| Republican | Morgan Osborne | 32,541 | 13.6 | |
| Total votes | 239,580 | 100.0 | ||
| Democratic hold | ||||
2014 edit
| Party | Candidate | Votes | % | |
|---|---|---|---|---|
| Democratic | Karen Bass (Incumbent) | 96,787 | 84.3 | |
| Republican | R. Adam King | 18,051 | 15.7 | |
| Total votes | 114,838 | 100.0 | ||
| Democratic hold | ||||
2016 edit
| Party | Candidate | Votes | % | |
|---|---|---|---|---|
| Democratic | Karen Bass (Incumbent) | 192,490 | 81.1 | |
| Democratic | Chris Blake Wiggins | 44,782 | 18.9 | |
| Total votes | 237,272 | 100.0 | ||
| Democratic hold | ||||
2018 edit
| Party | Candidate | Votes | % | |
|---|---|---|---|---|
| Democratic | Karen Bass (Incumbent) | 210,555 | 89.1 | |
| Republican | Ron J. Bassilian | 25,823 | 10.9 | |
| Total votes | 236,378 | 100.0 | ||
| Democratic hold | ||||
2020 edit
| Party | Candidate | Votes | % | |
|---|---|---|---|---|
| Democratic | Karen Bass (Incumbent) | 254,916 | 85.9 | |
| Republican | Errol Webber | 41,705 | 14.1 | |
| Total votes | 296,621 | 100.0 | ||
| Democratic hold | ||||
2022 edit
| Party | Candidate | Votes | % | |
|---|---|---|---|---|
| Democratic | Sydney Kamlager-Dove | 84,338 | 64.0 | |
| Democratic | Jan Perry | 47,542 | 36.0 | |
| Total votes | 131,880 | 100.0 | ||
| Democratic hold | ||||
Historical district boundaries edit
From 2003 through 2013, the district consisted of central Los Angeles County, from Compton to Long Beach. Due to redistricting after the 2010 United States census, the district has moved northwest within Los Angeles County and includes Culver City and Inglewood.
See also edit
References edit
- ^ a b "Congressional District 37, CA". U.S. Census Bureau. Retrieved October 5, 2023.
- ^ "2022 Cook PVI: District Map and List". Cook Political Report. Retrieved January 10, 2023.
- ^ Statement of Vote (1990 Governor)
- ^ Statement of Vote (1992 President)
- ^ Statement of Vote (1992 Senate)
- ^ Statement of Vote (1992 Senate)
- ^ Statement of Vote (1994 Governor)
- ^ Statement of Vote (1994 Senate)
- ^ Statement of Vote (1996 President)
- ^ Statement of Vote (1998 Governor) Archived September 29, 2011, at the Wayback Machine
- ^ Statement of Vote (1998 Senate) Archived September 29, 2011, at the Wayback Machine
- ^ Statement of Vote (2000 President)
- ^ Statement of Vote (2000 Senator)
- ^ Statement of Vote (2002 Governor)
- ^ Statement of Vote (2003 Recall Question)
- ^ Statement of Vote (2003 Governor)
- ^ Statement of Vote (2004 President)
- ^ Statement of Vote (2004 Senator)
- ^ Statement of Vote (2006 Governor)
- ^ Statement of Vote (2006 Senator)
- ^ Statement of Vote (2008 President)
- ^ Statement of Vote (2010 Governor)
- ^ Statement of Vote (2010 Senator)
- ^ Statement of Vote (2012 President)
- ^ Statement of Vote (2012 Senator)
- ^ Statement of Vote (2014 Governor)
- ^ Statement of Vote (2016 President)
- ^ Statement of Vote (2016 Senator)
- ^ Statement of Vote (2018 Governor)
- ^ Statement of Vote (2018 Senator)
- ^ "Daily Kos Elections' presidential results by congressional district for 2020, 2016, and 2012".
- ^ "Our Campaigns - CA Governor - Recall Question Race - Sep 14, 2021".
- ^ "Counties by Congressional Districts for Governor" (PDF). sos.ca.gov. November 8, 2022. Retrieved May 4, 2023.
- ^ 1962 election results
- ^ 1964 election results
- ^ 1966 election results
- ^ 1968 election results
- ^ 1970 election results
- ^ 1972 election results
- ^ 1974 election results
- ^ 1975 special election results
- ^ 1976 election results
- ^ 1978 election results
- ^ 1980 election results
- ^ 1982 election results
- ^ 1984 election results
- ^ 1986 election results
- ^ 1988 election results
- ^ 1990 election results
- ^ 1992 election results
- ^ 1994 election results
- ^ 1996 special election results
- ^ 1996 election results
- ^ 1998 election results
- ^ 2000 election results
- ^ 2002 election results
- ^ 2004 election results
- ^ 2006 election results
- ^ 2007 special election results
- ^ 2008 election results
- ^ 2010 election results
- ^ 2012 election results
- ^ 2014 election results
- ^ 2016 election results
- ^ 2018 election results
- ^ 2020 election results
External links edit
- Current (post 2012) district map—GovTrack.us: California's 37th congressional district
- Historic district descriptions -- RAND California Election Returns: District Definitions
- Historic (2012 and earlier) district map -- California Voter Foundation map - CD37
34°00′58″N 118°22′07″W / 34.01611°N 118.36861°W