


Summary
The 2016 United States Senate election in North Carolina was held November 8, 2016, to elect a member of the United States Senate to represent the State of North Carolina, concurrently with the 2016 U.S. presidential election, as well as other elections to the United States Senate in other states and elections to the United States House of Representatives and various state and local elections. Primary elections were held March 15.[1]
| |||||||||||||||||
| |||||||||||||||||
  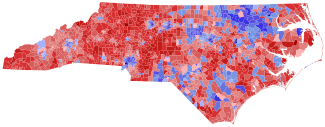 Burr: 40–50% 50–60% 60–70% 70–80% 80–90% >90% Ross: 40–50% 50–60% 60–70% 70–80% 80–90% >90% Tie: 40–50% | |||||||||||||||||
| |||||||||||||||||

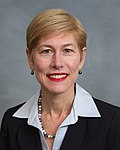
Incumbent Republican Senator Richard Burr won re-election to a third term in office against Democratic former state representative Deborah Ross and Libertarian Sean Haugh.
Republican primary edit
There had been speculation that Burr might retire,[2] but he said in September 2014 that he was "planning" on running[3] and reaffirmed this in January 2015.[4] If Burr had retired, the seat was expected to draw significant interest, with potential Republican candidates including U.S. representatives George Holding, Mark Meadows, and Robert Pittenger, Labor Commissioner Cherie Berry, Lieutenant Governor Dan Forest, Agriculture Commissioner Steve Troxler, State Senator Phil Berger, and former Ambassador to Denmark James P. Cain.[2][3]
Candidates edit
Declared edit
- Greg Brannon, physician, Tea Party activist and candidate for the U.S. Senate in 2014[5][6]
- Richard Burr, incumbent U.S. Senator[3]
- Larry Holmquist, businessman and Tea Party activist[7][8]
- Paul Wright, former Superior Court judge, candidate for governor in 2012 and nominee for NC-04 in 2014[9]
Declined edit
- Mark Meadows, U.S. Representative (running for re-election)[10][11][12]
Polling edit
| Poll source | Date(s) administered |
Sample size |
Margin of error |
Richard Burr |
Greg Brannon |
Paul Wright |
Larry Holmquist |
Undecided |
|---|---|---|---|---|---|---|---|---|
| Public Policy Polling | March 11–13, 2016 | 749 | ±3.6% | 48% | 20% | 4% | 3% | 24% |
| High Point University | March 9–10, 2016 | 734 | ±2.5% | 56% | 20% | 5% | 3% | 17% |
| SurveyUSA | March 4–7, 2016 | 688 | ±3.8% | 45% | 17% | 7% | 4% | 27% |
| SurveyUSA | February 14–16, 2016 | 437 | ±2.8% | 45% | 14% | 6% | 6% | 30% |
| Public Policy Polling | February 14–16, 2016 | 597 | ±4.0% | 56% | 13% | 4% | 3% | 24% |
| High Point University | January 30 – February 4, 2016 | 477 | ±4.5% | 46% | 10% | 5% | 2% | 37% |
| Public Policy Polling | January 18–19, 2016 | 433 | ±3.2% | 55% | 10% | 6% | 5% | 24% |
| Poll source | Date(s) administered |
Sample size |
Margin of error |
Richard Burr |
Mark Meadows |
Undecided |
|---|---|---|---|---|---|---|
| Public Policy Polling | July 2–6, 2015 | 288 | ± 5.8% | 62% | 9% | 28% |
Results edit
| Party | Candidate | Votes | % | |
|---|---|---|---|---|
| Republican | Richard Burr (incumbent) | 622,074 | 61.41% | |
| Republican | Greg Brannon | 255,030 | 25.17% | |
| Republican | Paul Wright | 85,944 | 8.48% | |
| Republican | Larry Holmquist | 50,010 | 4.94% | |
| Total votes | 1,013,058 | 100.00% | ||
Democratic primary edit
Candidates edit
Declared edit
- Kevin Griffin, businessman[14]
- Ernest Reeves, retired U.S. Army captain, candidate for the U.S. Senate in 2014 and candidate for Mayor of Greenville in 2015[15]
- Chris Rey, Mayor of Spring Lake[16]
- Deborah Ross, former state representative[17]
Declined edit
- Dan Blue, Minority Leader of the North Carolina Senate and candidate for the U.S. Senate in 2002[18][19][20]
- Roy Cooper, North Carolina Attorney General (running for Governor)[21]
- Janet Cowell, North Carolina State Treasurer[2][18][19][22]
- Cal Cunningham, former state senator and candidate for the U.S. Senate in 2010[18][20][23]
- Joel Ford, state senator[24][25][26]
- Anthony Foxx, United States Secretary of Transportation and former Mayor of Charlotte[3][27][28]
- Kay Hagan, former U.S. Senator[29]
- Duane Hall, state representative[30]
- Larry Hall, Minority Leader of the North Carolina House of Representatives[18][31]
- Jeff Jackson, state senator[19][32]
- Allen Joines, Mayor of Winston-Salem (running for re-election)[18][33]
- Grier Martin, state representative[2][19][34]
- Nancy McFarlane, Independent Mayor of Raleigh[2]
- Mike McIntyre, former U.S. Representative[18]
- Charles Meeker, former mayor of Raleigh (running for Labor Commissioner)[18][20]
- Brad Miller, former U.S. Representative[18][20]
- Thomas W. Ross, outgoing president of the University of North Carolina system[35][36]
- Heath Shuler, former U.S. Representative[18][37][38]
- Josh Stein, state senator (running for Attorney General)[39][40]
- Allen M. Thomas, mayor of Greenville[41]
- Beth Wood, state auditor (running for re-election)[42]
Polling edit
| Poll source | Date(s) administered |
Sample size |
Margin of error |
Kevin Griffin |
Ernest Reeves |
Chris Rey |
Deborah Ross |
Undecided |
|---|---|---|---|---|---|---|---|---|
| Public Policy Polling | March 11–13, 2016 | 746 | ±3.6% | 4% | 8% | 8% | 40% | 41% |
| High Point University | March 9–10, 2016 | 669 | ±2.5% | 9% | 5% | 7% | 52% | 27% |
| SurveyUSA | March 4–7, 2016 | 687 | ±3.8% | 7% | 6% | 9% | 34% | 44% |
| SurveyUSA | February 14–16, 2016 | 449 | ±2.8% | 7% | 3% | 5% | 30% | 55% |
| Public Policy Polling | February 14–16, 2016 | 575 | ±4.1% | 10% | 2% | 10% | 22% | 55% |
| High Point University | January 30 – February 4, 2016 | 478 | ±4.5% | 6% | 4% | 5% | 19% | 66% |
| Public Policy Polling | January 18–19, 2016 | 461 | ±3.2% | 14% | 3% | 10% | 19% | 55% |
| Public Policy Polling | December 5–7, 2015 | 555 | ±2.8% | 15% | - | 5% | 41% | 39% |
| Public Policy Polling | October 23–25, 2015 | 421 | ±4.8% | 16% | - | 6% | 33% | 45% |
Results edit
| Party | Candidate | Votes | % | |
|---|---|---|---|---|
| Democratic | Deborah Ross | 614,414 | 62.32% | |
| Democratic | Chris Rey | 162,869 | 16.52% | |
| Democratic | Kevin Griffin | 115,618 | 11.73% | |
| Democratic | Ernest Reeves | 93,005 | 9.43% | |
| Total votes | 985,906 | 100.00% | ||
Libertarian primary edit
Candidates edit
Declared edit
- Sean Haugh, pizza delivery man and nominee for the U.S. Senate in 2002 and 2014[44]
General election edit
Candidates edit
- Richard Burr (R), incumbent U.S. Senator
- Sean Haugh (L), pizza delivery man and nominee for the U.S. Senate in 2002 and 2014
- Deborah Ross (D), former state representative
Debates edit
| Dates | Location | Burr | Ross | Link |
|---|---|---|---|---|
| October 13, 2016 | Chapel Hill, North Carolina | Participant | Participant | Full debate - C-SPAN |
Endorsements edit
- U.S. presidents
- U.S. senators
- John Cornyn, United States Senator from Texas and Senate Majority Whip[46]
- Ted Cruz, United States Senator from Texas and 2016 presidential candidate[46]
- Individuals
- Organizations
- Newspapers
- Presidents
- Vice presidents
- U.S. cabinet members and cabinet-level officials
- Hillary Clinton, 67th United States Secretary of State, 2008 presidential candidate and 2016 presidential nominee[52]
- U.S. senators
- Barbara Boxer, California[54]
- Sherrod Brown, Ohio[55]
- Kirsten Gillibrand, New York[56]
- Bernie Sanders, Vermont[57]
- Elizabeth Warren, Massachusetts[52]
- Individuals
- Bob Edwards, Mayor of Nags Head, North Carolina[58]
- Larry Marciniak, former Franklin County, North Carolina Democratic Party Chair[59]
- Labor unions
- Organizations
- Democratic Senatorial Campaign Committee[61]
- EMILY's List[62]
- Human Rights Campaign[63]
- League of Conservation Voters[64]
- National Committee to Preserve Social Security and Medicare[65]
- Our Revolution[66]
- Planned Parenthood[67]
- Sierra Club[68]
- U.S. Women's Chamber of Commerce[citation needed]
- Newspapers
Predictions edit
| Source | Ranking | As of |
|---|---|---|
| The Cook Political Report[74] | Tossup | November 2, 2016 |
| Sabato's Crystal Ball[75] | Lean R | November 7, 2016 |
| Rothenberg Political Report[76] | Tossup | November 3, 2016 |
| Daily Kos[77] | Tossup | November 8, 2016 |
| Real Clear Politics[78] | Tossup | November 7, 2016 |
Polling edit
| Poll source | Date(s) administered |
Sample size |
Margin of error |
Richard Burr (R) |
Deborah Ross (D) |
Sean Haugh (L) |
Other | Undecided |
|---|---|---|---|---|---|---|---|---|
| SurveyMonkey | November 1–7, 2016 | 3,126 | ±4.6% | 43% | 47% | 6% | – | 4% |
| New York Times Upshot/Siena College Archived January 16, 2018, at the Wayback Machine | November 4–6, 2016 | 800 | ±3.5% | 46% | 45% | – | – | 9% |
| Quinnipiac University Archived November 7, 2016, at the Wayback Machine | November 3–6, 2016 | 870 | ±3.3% | 47% | 47% | – | 1% | 4% |
| SurveyMonkey | October 31 – November 6, 2016 | 2,865 | ±4.6% | 44% | 47% | 6% | – | 3% |
| Breitbart/Gravis Marketing | November 1–4, 2016 | 1,250 | ±2.8% | 47% | 48% | – | – | 5% |
| SurveyMonkey | October 28 – November 3, 2016 | 2,292 | ±4.6% | 44% | 47% | 6% | – | 3% |
| SurveyMonkey | October 27 – November 2, 2016 | 1,886 | ±4.6% | 44% | 47% | 6% | – | 3% |
| Public Policy Polling | October 31 – November 1, 2016 | 1,169 | ±2.9% | 48% | 45% | – | – | 7% |
| Quinnipiac University Archived November 4, 2016, at the Wayback Machine | October 27 – November 1, 2016 | 602 | ±4.0% | 45% | 49% | – | 1% | 5% |
| SurveyMonkey | October 26 – November 1, 2016 | 1,617 | ±4.6% | 43% | 47% | 6% | – | 4% |
| SurveyUSA | October 28–31, 2016 | 659 | ±3.9% | 49% | 43% | 2% | – | 6% |
| SurveyMonkey | October 25–31, 2016 | 1,574 | ±4.6% | 43% | 47% | 7% | – | 3% |
| CBS News/YouGov | October 26–28, 2016 | 992 | ±4.1% | 44% | 44% | – | 1% | 10% |
| Emerson College | October 26–27, 2016 | 650 | ±3.8% | 48% | 44% | – | 3% | 6% |
| Elon University Poll Archived November 3, 2016, at the Wayback Machine | October 23–27, 2016 | 710 | ±3.7% | 44% | 40% | 3% | – | 11% |
| Breitbart/Gravis Marketing | October 25–26, 2016 | 1,273 | ±2.8% | 45% | 48% | – | – | 7% |
| NBC/WSJ/Marist | October 25–26, 2016 | 780 LV | ±3.5% | 48% | 48% | – | 2% | 3% |
| 1,018 RV | ±3.1% | 48% | 46% | – | 2% | 4% | ||
| Quinnipiac University Archived July 30, 2019, at the Wayback Machine | October 20–26, 2016 | 702 | ±3.7% | 48% | 47% | – | – | 5% |
| New York Times Upshot/Siena College | October 20–23, 2016 | 792 | ±3.5% | 46% | 47% | – | – | 7% |
| Monmouth University | October 20–23, 2016 | 402 | ±4.9% | 49% | 43% | 2% | – | 5% |
| Public Policy Polling | October 21–22, 2016 | 875 | ±3.3% | 42% | 41% | 6% | – | 11% |
| The Times-Picayune/Lucid Archived October 22, 2016, at the Wayback Machine | October 17–18, 2016 | 924 | ±3.0% | 46% | 44% | – | – | 10% |
| SurveyUSA | October 14–18, 2016 | 651 | ±3.9% | 45% | 43% | 6% | – | 6% |
| Civitas Institute (R) | October 14–17, 2016 | 600 | ±4.0% | 44% | 37% | 4% | – | 11% |
| Washington Post/SurveyMonkey Archived October 19, 2016, at the Wayback Machine | October 8–16, 2016 | 1,191 | ±0.5% | 42% | 48% | – | 7% | 3% |
| CNN/ORC | October 10–15, 2016 | 788 LV | ±3.5% | 48% | 47% | – | – | 2% |
| 929 RV | ±3.0% | 46% | 49% | – | 1% | 2% | ||
| NBC/WSJ/Marist | October 10–12, 2016 | 743 LV | ±3.6% | 46% | 46% | – | 2% | 6% |
| 1,025 RV | ±3.1% | 45% | 46% | – | 2% | 7% | ||
| Emerson College | October 10–12, 2016 | 600 | ±3.9% | 45% | 43% | – | 3% | 8% |
| Suffolk University Archived October 22, 2016, at the Wayback Machine | October 10–12, 2016 | 500 | ±4.4% | 40% | 36% | 6% | – | 16% |
| NCSU Pack Poll Archived October 18, 2016, at the Wayback Machine | October 3–6, 2016 | 895 | ±3.0% | 39% | 49% | 12% | – | 0% |
| High Point University | October 1–6, 2016 | 479 | ±4.5% | 47% | 42% | 6% | – | 4% |
| SurveyUSA | September 29 – October 3, 2016 | 656 | ±3.9% | 46% | 44% | 3% | – | 7% |
| Bloomberg/Selzer | September 29 – October 3, 2016 | 805 | ±3.5% | 44% | 46% | – | – | 11% |
| Quinnipiac University Archived October 6, 2016, at the Wayback Machine | September 27 – October 2, 2016 | 507 | ±4.4% | 46% | 46% | – | – | 7% |
| Elon University Poll Archived October 5, 2016, at the Wayback Machine | September 27–30, 2016 | 660 | ±3.8% | 43% | 44% | 4% | – | 8% |
| Public Policy Polling | September 27–28, 2016 | 861 | ±3.3% | 41% | 39% | 6% | – | 14% |
| 46% | 42% | – | – | 12% | ||||
| Breitbart/Gravis Marketing | September 23, 2016 | 694 | ±3.7% | 39% | 48% | – | – | 13% |
| Meredith College Archived September 30, 2016, at the Wayback Machine | September 18–22, 2016 | 487 | ±4.4% | 35% | 38% | 1% | 7% | 19% |
| High Point University | September 17–22, 2016 | 404 | ±4.9% | 45% | 43% | 4% | – | 6% |
| FOX News | September 18–20, 2016 | 734 LV | ±3.5% | 43% | 37% | 6% | – | 12% |
| 800 RV | 42% | 36% | 7% | – | 13% | |||
| Public Policy Polling | September 18–20, 2016 | 1,024 | ±3.1% | 41% | 41% | 4% | – | 15% |
| New York Times Upshot/Siena College | September 16–19, 2016 | 782 | ±3.6% | 42% | 46% | – | – | 11% |
| Greenberg Quinlan Rosner - Democracy Corps Archived September 23, 2016, at the Wayback Machine | September 10–19, 2016 | 400 | ±4.0% | 46% | 30% | – | 3% | 21% |
| Elon University Poll Archived September 19, 2016, at the Wayback Machine | September 12–16, 2016 | 644 | ±3.9% | 43% | 44% | 4% | – | 9% |
| Civitas Institute (R) | September 11–12, 2016 | 600 | ±4.0% | 44% | 39% | 2% | – | 15% |
| Suffolk University Archived September 8, 2016, at the Wayback Machine | September 5–7, 2016 | 500 | ±4.4% | 41% | 37% | 4% | – | 16% |
| Quinnipiac University Archived September 15, 2016, at the Wayback Machine | August 29 – September 7, 2016 | 751 | ±3.6% | 49% | 43% | – | – | 8% |
| CBS News/YouGov | August 30 – September 2, 2016 | 1,088 | ±4.0% | 40% | 41% | – | 2% | 17% |
| Emerson College | August 27–29, 2016 | 800 | ±3.4% | 45% | 41% | – | 5% | 14% |
| Public Policy Polling | August 26–27, 2016 | 1,177 | ±3.0% | 46% | 43% | – | – | 12% |
| Monmouth University | August 20–23, 2016 | 401 | ±4.9% | 45% | 43% | 4% | – | 8% |
| CNN/ORC | August 18–23, 2016 | 803 | ±3.5% | 50% | 45% | – | – | 5% |
| NBC/WSJ/Marist | August 4–10, 2016 | 921 | ±3.2% | 44% | 46% | – | 1% | 9% |
| Public Policy Polling | August 5–7, 2016 | 830 | ±3.4% | 41% | 37% | 5% | – | 17% |
| NBC/WSJ/Marist | July 5–11, 2016 | 907 | ±3.3% | 48% | 41% | – | 1% | 10% |
| Public Policy Polling | June 20–21, 2016 | 947 | ±3.2% | 40% | 37% | 5% | – | 18% |
| Greenberg Quinlan Rosner - Democracy Corps Archived July 5, 2016, at the Wayback Machine | June 11–20, 2016 | 300 | ±5.7% | 36% | 38% | – | – | 26% |
| Public Policy Polling | May 20–22, 2016 | 928 | ±3.2% | 39% | 36% | 8% | – | 18% |
| Civitas Institute (R) | April 23–25, 2016 | 600 | ±4.0% | 39% | 38% | 7% | – | 16% |
| Public Policy Polling | April 22–24, 2016 | 960 | ±3.2% | 40% | 36% | 7% | – | 17% |
| Elon University Poll | April 10–15, 2016 | 621 | ±3.9% | 37% | 33% | – | – | 30% |
| Public Policy Polling | March 18–20, 2016 | 843 | ±3.4% | 40% | 35% | 7% | – | 18% |
| High Point University | March 9–10, 2016 | 1,576 | ±2.5% | 48% | 41% | – | – | 11% |
| SurveyUSA | February 14–16, 2016 | 1,250 | ±2.8% | 45% | 37% | – | – | 18% |
| Public Policy Polling | February 14–16, 2016 | 1,291 | ±2.7% | 43% | 37% | – | – | 20% |
| Public Policy Polling | January 18–19, 2016 | 948 | ±3.2% | 43% | 33% | – | – | 23% |
| Public Policy Polling | December 5–7, 2015 | 1,214 | ±2.8% | 46% | 35% | – | – | 19% |
| Public Policy Polling | October 23–25, 2015 | 893 | ±3.3% | 43% | 39% | – | – | 18% |
| Public Policy Polling | September 24–27, 2015 | 1,268 | ±2.8% | 45% | 34% | – | – | 21% |
| Public Policy Polling | August 12–16, 2015 | 957 | ±3.2% | 43% | 36% | – | – | 21% |
- With Burr
| Poll source | Date(s) administered |
Sample size |
Margin of error |
Richard Burr (R) |
Kevin Griffin (D) |
Undecided |
|---|---|---|---|---|---|---|
| SurveyUSA | February 14–16, 2016 | 1,250 | ±2.8% | 45% | 35% | 20% |
| Public Policy Polling | February 14–16, 2016 | 1,291 | ±2.7% | 43% | 36% | 21% |
| Public Policy Polling | January 18–19, 2016 | 948 | ±3.2% | 42% | 35% | 24% |
| Public Policy Polling | December 5–7, 2015 | 1,214 | ± 2.8% | 46% | 35% | 19% |
| Public Policy Polling | October 23–25, 2015 | 893 | ± 3.3% | 44% | 35% | 21% |
| Poll source | Date(s) administered |
Sample size |
Margin of error |
Richard Burr (R) |
Chris Rey (D) |
Undecided |
|---|---|---|---|---|---|---|
| SurveyUSA | February 14–16, 2016 | 1,250 | ±2.8% | 46% | 34% | 20% |
| Public Policy Polling | February 14–16, 2016 | 1,291 | ±2.7% | 43% | 36% | 21% |
| Public Policy Polling | January 18–19, 2016 | 948 | ±3.2% | 44% | 32% | 24% |
| Public Policy Polling | December 5–7, 2015 | 1,214 | ± 2.8% | 47% | 33% | 21% |
| Public Policy Polling | October 23–25, 2015 | 893 | ± 3.3% | 45% | 34% | 21% |
| Public Policy Polling | September 24–27, 2015 | 1,268 | ± 2.8% | 46% | 34% | 20% |
| Public Policy Polling | August 12–16, 2015 | 957 | ± 3.2% | 44% | 37% | 20% |
| Poll source | Date(s) administered |
Sample size |
Margin of error |
Richard Burr (R) |
Dan Blue (D) |
Undecided |
|---|---|---|---|---|---|---|
| Public Policy Polling | July 2–6, 2015 | 529 | ± 4.1% | 45% | 35% | 19% |
| Public Policy Polling | May 28–31, 2015 | 561 | ± 4.1% | 48% | 34% | 18% |
| Public Policy Polling | April 2–5, 2015 | 751 | ± 3.6% | 47% | 36% | 17% |
| Poll source | Date(s) administered |
Sample size |
Margin of error |
Richard Burr (R) |
Roy Cooper (D) |
Undecided |
|---|---|---|---|---|---|---|
| Meeting Street Research Archived February 6, 2015, at the Wayback Machine | January 21–22, 2015 | 500 | ± 4.38% | 44% | 41% | 15% |
| Poll source | Date(s) administered |
Sample size |
Margin of error |
Richard Burr (R) |
Janet Cowell (D) |
Undecided |
|---|---|---|---|---|---|---|
| Public Policy Polling | April 2–5, 2015 | 751 | ± 3.6% | 46% | 35% | 19% |
| Public Policy Polling | February 24–26, 2015 | 849 | ± 3.4% | 44% | 38% | 18% |
| Public Policy Polling | January 29–31, 2015 | 845 | ± 3.4% | 45% | 38% | 18% |
| Public Policy Polling | December 4–7, 2014 | 823 | ± 3.4% | 44% | 38% | 17% |
| Public Policy Polling | August 14–17, 2014 | 856 | ± 3.4% | 44% | 37% | 19% |
| Poll source | Date(s) administered |
Sample size |
Margin of error |
Richard Burr (R) |
Anthony Foxx (D) |
Undecided |
|---|---|---|---|---|---|---|
| Public Policy Polling | February 24–26, 2015 | 849 | ± 3.4% | 45% | 36% | 20% |
| Public Policy Polling | January 29–31, 2015 | 845 | ± 3.4% | 47% | 36% | 17% |
| Public Policy Polling | December 4–7, 2014 | 823 | ± 3.4% | 44% | 38% | 18% |
| Public Policy Polling | August 14–17, 2014 | 856 | ± 3.4% | 45% | 35% | 19% |
| Poll source | Date(s) administered |
Sample size |
Margin of error |
Richard Burr (R) |
Kay Hagan (D) |
Other | Undecided |
|---|---|---|---|---|---|---|---|
| Public Policy Polling | May 28–31, 2015 | 561 | ± 4.1% | 49% | 40% | — | 11% |
| Elon University Poll Archived May 5, 2015, at the Wayback Machine | April 20–24, 2015 | 677 | ± 3.77% | 44% | 43% | 4% | 8% |
| Public Policy Polling | April 2–5, 2015 | 751 | ± 3.6% | 50% | 38% | — | 12% |
| Public Policy Polling | February 24–26, 2015 | 849 | ± 3.4% | 50% | 43% | — | 7% |
| Meeting Street Research Archived February 6, 2015, at the Wayback Machine | January 21–22, 2015 | 500 | ± 4.38% | 49% | 45% | — | 6% |
| Public Policy Polling | January 29–31, 2015 | 845 | ± 3.4% | 48% | 42% | — | 10% |
| Public Policy Polling | December 4–7, 2014 | 823 | ± 3.4% | 46% | 43% | — | 11% |
| Poll source | Date(s) administered |
Sample size |
Margin of error |
Richard Burr (R) |
Duane Hall (D) |
Undecided |
|---|---|---|---|---|---|---|
| Public Policy Polling | September 24–27, 2015 | 1,268 | ± 2.8% | 45% | 35% | 19% |
| Public Policy Polling | Aug 12-16, 2015 | 957 | ± 3.2% | 44% | 36% | 21% |
| Poll source | Date(s) administered |
Sample size |
Margin of error |
Richard Burr (R) |
Jeff Jackson (D) |
Undecided |
|---|---|---|---|---|---|---|
| Public Policy Polling | May 28–31, 2015 | 561 | ± 4.1% | 48% | 30% | 22% |
| Public Policy Polling | April 2–5, 2015 | 751 | ± 3.6% | 46% | 30% | 24% |
| Poll source | Date(s) administered |
Sample size |
Margin of error |
Richard Burr (R) |
Allen Joines (D) |
Undecided |
|---|---|---|---|---|---|---|
| Public Policy Polling | February 24–26, 2015 | 849 | ± 3.4% | 45% | 33% | 23% |
| Public Policy Polling | August 14–17, 2014 | 856 | ± 3.4% | 45% | 32% | 23% |
| Poll source | Date(s) administered |
Sample size |
Margin of error |
Richard Burr (R) |
Grier Martin (D) |
Undecided |
|---|---|---|---|---|---|---|
| Public Policy Polling | July 2–6, 2015 | 529 | ± 4.1% | 47% | 33% | 20% |
| Public Policy Polling | May 28–31, 2015 | 561 | ± 4.1% | 46% | 31% | 23% |
| Public Policy Polling | April 2–5, 2015 | 751 | ± 3.6% | 46% | 32% | 23% |
| Public Policy Polling | August 14–17, 2014 | 856 | ± 3.4% | 45% | 33% | 22% |
| Poll source | Date(s) administered |
Sample size |
Margin of error |
Richard Burr (R) |
Mike McIntyre (D) |
Undecided |
|---|---|---|---|---|---|---|
| Public Policy Polling | July 2–6, 2015 | 529 | ± 4.1% | 44% | 35% | 21% |
| Public Policy Polling | May 28–31, 2015 | 561 | ± 4.1% | 43% | 34% | 22% |
| Public Policy Polling | January 29–31, 2015 | 845 | ± 3.4% | 44% | 37% | 19% |
| Poll source | Date(s) administered |
Sample size |
Margin of error |
Richard Burr (R) |
Brad Miller (D) |
Undecided |
|---|---|---|---|---|---|---|
| Public Policy Polling | July 2–6, 2015 | 529 | ± 4.1% | 46% | 36% | 18% |
| Public Policy Polling | April 2–5, 2015 | 751 | ± 3.6% | 45% | 34% | 20% |
| Poll source | Date(s) administered |
Sample size |
Margin of error |
Richard Burr (R) |
Tom Ross (D) |
Undecided |
|---|---|---|---|---|---|---|
| Public Policy Polling | January 29–31, 2015 | 845 | ± 3.4% | 44% | 35% | 21% |
| Poll source | Date(s) administered |
Sample size |
Margin of error |
Richard Burr (R) |
Heath Shuler (D) |
Undecided |
|---|---|---|---|---|---|---|
| Public Policy Polling | September 24–27, 2015 | 1,268 | ± 2.8% | 42% | 37% | 20% |
| Public Policy Polling | Aug 12-16, 2015 | 957 | ± 3.2% | 42% | 35% | 22% |
| Public Policy Polling | July 2–6, 2015 | 529 | ± 4.1% | 44% | 36% | 20% |
| Poll source | Date(s) administered |
Sample size |
Margin of error |
Richard Burr (R) |
Beth Wood (D) |
Undecided |
|---|---|---|---|---|---|---|
| Public Policy Polling | July 2–6, 2015 | 529 | ± 4.1% | 45% | 34% | 21% |
- With Berger
| Poll source | Date(s) administered |
Sample size |
Margin of error |
Phil Berger (R) |
Janet Cowell (D) |
Undecided |
|---|---|---|---|---|---|---|
| Public Policy Polling | December 4–7, 2014 | 823 | ± 3.4% | 41% | 38% | 21% |
| Poll source | Date(s) administered |
Sample size |
Margin of error |
Phil Berger (R) |
Anthony Foxx (D) |
Undecided |
|---|---|---|---|---|---|---|
| Public Policy Polling | December 4–7, 2014 | 823 | ± 3.4% | 40% | 37% | 24% |
| Poll source | Date(s) administered |
Sample size |
Margin of error |
Phil Berger (R) |
Kay Hagan (D) |
Undecided |
|---|---|---|---|---|---|---|
| Public Policy Polling | December 4–7, 2014 | 823 | ± 3.4% | 45% | 43% | 13% |
Results edit
| Party | Candidate | Votes | % | ±% | |
|---|---|---|---|---|---|
| Republican | Richard Burr (incumbent) | 2,395,376 | 51.06% | −3.75% | |
| Democratic | Deborah Ross | 2,128,165 | 45.37% | +2.32% | |
| Libertarian | Sean Haugh | 167,592 | 3.57% | +1.48% | |
| Total votes | 4,691,133 | 100.00% | N/A | ||
| Republican hold | |||||
Counties that flipped from Democratic to Republican edit
- Bladen (largest town: Elizabethtown)
- Martin (largest town: Williamston)
- Robeson (largest city: Lumberton)
- Union (largest city: Indian Trail)
Counties that flipped from Republican to Democratic edit
- Guilford (largest municipality: Greensboro)
- Forsyth (largest town: Winston-Salem)
- Pitt (largest town: Greenville)
- Wake (largest town: Raleigh)
See also edit
References edit
- ^ WRAL: North Carolina primaries officially on March 15 with signing Archived October 2, 2015, at the Wayback Machine
- ^ a b c d e Cahn, Emily (December 11, 2013). "Opportunities Now and Later in North Carolina". Roll Call. Retrieved December 11, 2013.
- ^ a b c d "Rumors Aside, Burr Says He'll Run Again". National Journal. September 15, 2014. Archived from the original on September 19, 2014. Retrieved September 22, 2014.
- ^ "Sen. Burr confirms he will run in 2016". WNCN. January 6, 2015. Archived from the original on January 8, 2015. Retrieved January 8, 2015.
- ^ Brannon, Greg (December 21, 2015). "WATCH as I officially file as a Republican candidate for the United States Senate!". Facebook. Retrieved December 21, 2015.
- ^ Campbell, Colin (December 21, 2015). "Republican Greg Brannon challenges Richard Burr in second Senate bid". The News & Observer. Retrieved December 21, 2015.
- ^ Johnson, Paul B. (September 23, 2015). "Triad Republican to challenge Burr in Senate primary". High Point Enterprise. Retrieved October 13, 2015.[permanent dead link]
- ^ Krueger, Sarah (September 24, 2015). "Larry Holmquist enters Senate race, challenging Richard Burr". WGHP. Retrieved October 13, 2015.
- ^ "Former judge Wright running for Burr's Senate seat". Asheville Citizen-Times. September 11, 2015. Retrieved September 12, 2015.
- ^ Clifton, Brant (June 27, 2015). "#NCSEN: Draft Mark Meadows for, um, SENATE ????". The Daily Haymaker. Retrieved June 28, 2015.
- ^ Wynne, John (June 26, 2015). "Best Week in NC Politics: Rep. Mark Meadows". PoliticsNC. Retrieved June 28, 2015.
- ^ Barrett, Mark (December 1, 2015). "Mark Meadows files for third term". Asheville Citizen-Times. Retrieved December 3, 2015.
- ^ NC State Board of Elections
- ^ Leslie, Laura (October 15, 2015). "Durham businessman joining Dem field in US Senate race". WRAL-TV. Retrieved October 29, 2015.
- ^ "Candidate Listing" (PDF). North Carolina State Board of Elections. Retrieved December 21, 2015.[permanent dead link]
- ^ Woolverton, Paul (September 21, 2015). "Spring Lake Mayor Chris Rey announces run for US Senate". Fayetteville Observer. Retrieved September 21, 2015.
- ^ Burns, Matthew (October 14, 2015). "Ex-Wake lawmaker Ross enters US Senate race". WRAL-TV. Retrieved October 14, 2015.
- ^ a b c d e f g h i Cheney, Kyle (December 29, 2014). "16 in '16: The new battle for the Senate". Politico. Retrieved December 29, 2014.
- ^ a b c d Cahn, Emily (March 13, 2015). "Democrats Prep North Carolina Contingency Plan". Roll Call. Archived from the original on March 15, 2015. Retrieved March 13, 2015.
- ^ a b c d Curliss, J. Andrew (March 29, 2015). "Sunday Dome: US Sen. Burr plans fight against... (insert name here)". The News & Observer. Retrieved June 18, 2015.
- ^ "Attorney General Announces Candidacy For Governor". Charlotte Observer. November 6, 2014. Archived from the original on November 8, 2014. Retrieved November 7, 2014.
- ^ Mark Binke (October 13, 2015). "NC Treasurer Cowell won't seek re-election". WRAL-TV. Retrieved October 13, 2015.
- ^ Batts, Mat (December 17, 2015). "Group wants Cunningham to run in 8th District for Democrats". The Dispatch. Archived from the original on December 22, 2015. Retrieved December 18, 2015.
- ^ Pathé, Simone (August 28, 2015). "DSCC Talking to Potential Burr Challengers in North Carolina". Roll Call. Archived from the original on August 31, 2015. Retrieved August 31, 2015.
- ^ Wynne, John (August 31, 2015). "A New Name". PoliticsNC. Retrieved August 31, 2015.
- ^ Campbell, Colin (December 4, 2015). "NC Sen. Joel Ford won't run against Sen. Richard Burr". The News & Observer. Retrieved December 7, 2015.
- ^ Matt Vasilogambros (April 29, 2013). "What You Need to Know About Obama Transportation Pick Anthony Foxx". National Journal. Archived from the original on September 26, 2013. Retrieved September 9, 2013.
- ^ Kelly Cohen (September 17, 2014). "Foxx won't run for Senate in 2016". The Washington Examiner. Retrieved October 2, 2014.
- ^ Cahn, Emily; Lesniewski, Niels (June 23, 2015). "Kay Hagan Won't Challenge Richard Burr in 2016". Roll Call. Archived from the original on June 24, 2015. Retrieved June 23, 2015.
- ^ Bonner, Lynn (October 13, 2015). "NC Rep. Hall won't run for U.S. Senate". The News & Observer. Retrieved October 13, 2015.
- ^ "Candidates file to run for Durham county commissioners, DPS school board". The News & Observer. December 2, 2015. Retrieved December 3, 2015.
- ^ Wynne, John (June 11, 2015). "Jeff Jackson: Running for (State) Senate". PoliticsNC. Retrieved June 11, 2015.
- ^ Young, Wesley (September 9, 2015). "Joines announces plans to run for fifth term". Winston-Salem Journal. Retrieved September 10, 2015.
- ^ Binker, Mark (October 10, 2015). "Dems search for a challenger to Burr". WRAL-TV. Retrieved October 14, 2015.
- ^ D.G. Martin (January 26, 2015). "Tom Ross: 30 Years Later, in William Friday's Footsteps". Chapel Hill News. Archived from the original on January 30, 2015. Retrieved January 29, 2015.
- ^ Cook, Austin (November 5, 2015). "Ross passes on 2016 U.S. Senate bid". Old Gold & Black. Archived from the original on November 26, 2015. Retrieved December 3, 2015.
- ^ Roarty, Alex (August 6, 2015). "Heath Shuler Is Exploring a North Carolina Senate Run". National Journal. Retrieved August 7, 2015.
- ^ Pathé, Simone (October 5, 2015). "Democrats Still Seek Strong Challenger to Burr in North Carolina". Roll Call. Archived from the original on October 6, 2015. Retrieved October 7, 2015.
- ^ Roarty, Alex (June 24, 2015). "Hagan's Decision Leaves Democrats With Few Options in North Carolina". National Journal. Retrieved June 30, 2015.
- ^ Wuzzardo, Kevin (July 14, 2015). "Stein Off List of Potential Challengers to Sen. Burr". WWAY. Retrieved July 16, 2015.
- ^ Colin Campbell (January 2, 2015). "Greenville mayor says a 2016 run against Sen. Richard Burr is 'speculation'". The News & Observer. Archived from the original on January 6, 2015. Retrieved January 6, 2015.
- ^ Wuzzardo, Kevin (May 4, 2015). "NC State Auditor Beth Wood Running for Re-election". WWAY. Retrieved August 31, 2015.
- ^ NC State Board of Elections
- ^ Ziggler, Jed (October 7, 2015). "Sean Haugh: "I Intend to Run for U.S. Senate as a Libertarian in North Carolina in 2016"". Independent Political Report. Retrieved October 13, 2015.
- ^ Campbell, Colin (October 11, 2016). "George W. Bush in Raleigh for Sen. Richard Burr fundraiser". The News & Observer.
- ^ a b Jeffers, Gromer (October 4, 2016). "Ted Cruz, John Cornyn hosting Dallas fundraiser for U.S. Senate candidates". Dallas News. Retrieved October 7, 2016.
- ^ Arkin, James (January 8, 2016). "Bolton Endorses 16 for Re-Election to Congress". RealClearPolitics. Archived from the original on January 16, 2016. Retrieved January 10, 2016.
- ^ "ACU Endorses Richard Burr". American Conservative Union. Archived from the original on July 30, 2018. Retrieved July 30, 2018.
- ^ "Vote Richard Burr for U.S. Senate: A+ Rated and Endorsed". NRA-PVF. Archived from the original on October 29, 2016. Retrieved October 29, 2016.
{{cite web}}: CS1 maint: unfit URL (link) - ^ "Burr, Butterfield, Jones for U.S. Congress". The Daily Reflector. October 27, 2016. Archived from the original on October 29, 2016. Retrieved October 29, 2016.
- ^ "Decision 2016: Our endorsements for Congress". Winston-Salem Journal. October 16, 2016. Retrieved October 29, 2016.
- ^ a b c Din, Benjamin (October 26, 2016). "Elizabeth Warren Stumps for Hillary Clinton, Focuses on Senate Race in N.C." U.S. News & World Report. Retrieved October 29, 2016.
- ^ "NC-Sen: Joe Boden goes all in to help Deborah Ross (D) take back the Senate – Daily Kos". Daily Kos. November 2, 2016. Retrieved November 3, 2016.
- ^ "NV, NH, NC & PA-Sen: Sen. Barbara Boxer (D. CA) helps these women take back the U.S. Senate". Daily Kos. October 29, 2016. Retrieved November 2, 2016.
- ^ "IL, AZ, FL & NC-Sen: Sen. Sherrod Brown (D. OH) gives a grassroots boost to Dems in these races". Daily Kos. September 28, 2016. Retrieved November 3, 2016.
- ^ "Kirsten Gillibrand (D. NY) gives Deborah Ross' (D) campaign a boost". Daily Kos. September 2, 2016. Retrieved November 2, 2016.
- ^ Parks, Maryalice (October 26, 2016). "Bernie Sanders Is Trying to Be a Kingmaker in Key Congressional Races". ABC News. Retrieved October 29, 2016.
- ^ "Nags Head Mayor Bob Edwards is the latest to join Team Deborah". Deborah Ross for US Senate. December 23, 2015. Retrieved January 21, 2016.
- ^ Marciniak, Larry (December 14, 2015). "The Endorsement Of Deborah Ross". Tell The Truth On Them. Archived from the original on January 27, 2016. Retrieved January 21, 2016.
- ^ "Ross, Cooper, Coleman get North Carolina AFL-CIO endorsement". WECT. Associated Press. January 19, 2016. Archived from the original on January 22, 2016. Retrieved January 21, 2016.
- ^ Morrill, Jim (January 21, 2016). "Democratic Senatorial Campaign Committee backs Ross for U.S. Senate". Charlotte Observer. Retrieved January 21, 2016.
- ^ "Deborah Ross- EMILY's List". EMILY's List. January 21, 2016. Archived from the original on January 28, 2016. Retrieved January 21, 2016.
- ^ Lorenz, Brandon (October 10, 2016). "HRC Endorses Deborah Ross of North Carolina for U.S. Senate". Human Rights Campaign. Archived from the original on November 9, 2016. Retrieved October 29, 2016.
- ^ Blatt, Hannah (February 25, 2016). "LCV Action Fund Endorses Deborah Ross for U.S. Senate". League of Conservation Voters. Archived from the original on February 26, 2016. Retrieved October 29, 2016.
- ^ McCarter, Joan (August 2, 2016). "North Carolina Democrat Deborah Ross wins key endorsement on support for Social Security, Medicare". Daily Kos. Retrieved October 29, 2016.
- ^ Easley, Cameron (September 20, 2016). "Bernie Sanders' Group Endorses Deborah Ross". Morning Consult. Archived from the original on October 18, 2016. Retrieved October 29, 2016.
- ^ "Planned Parenthood Action Fund endorses Deborah Ross for U.S. Senate". March 7, 2016. Archived from the original on April 21, 2016. Retrieved October 29, 2016.
- ^ Letters (October 20, 2016). "Letter writer: Sierra Club endorses candidates in local elections". Mountain Xpress. Retrieved October 29, 2016.
- ^ "Our choice in North Carolina's U.S. Senate race". The Charlotte Observer. October 18, 2016. Retrieved October 29, 2016.
- ^ "Endorsements: Ross for U.S. Senate, Cooper for governor Change needed in Washington and Raleigh". The Charlotte Post. October 26, 2016. Archived from the original on October 29, 2016. Retrieved October 29, 2016.
- ^ "The INDY Endorses Deborah Ross for U.S. Senate". Indy Week. October 19, 2016. Retrieved October 29, 2016.
- ^ "North Carolina's chance for a fresh Senate voice". The New York Times. October 26, 2016. Retrieved October 29, 2016.
- ^ "Our Opinion: Deborah Ross for Senate". News & Record. October 24, 2016. Retrieved October 29, 2016.
- ^ "2016 Senate Race Ratings for November 2, 2016". The Cook Political Report. Retrieved March 26, 2021.
- ^ "2016 Senate". Sabato's Crystal Ball. Retrieved September 19, 2016.
- ^ "2016 Senate Ratings". Senate Ratings. The Rothenberg Political Report. Retrieved November 3, 2016.
- ^ "Daily Kos Election 2016 forecast: The final version". Daily Kos. Retrieved March 27, 2021.
- ^ "Battle for the Senate 2016". Real Clear Politics. Retrieved October 28, 2016.
- ^ "North Carolina Official General Election Results". North Carolina State Board of Elections. November 8, 2016. Retrieved January 4, 2017.
External links edit
- Official campaign websites (archived)
- Richard Burr (R) for Senate
- Deborah Ross (D) for Senate
- Sean Haugh (L) for Senate