


Summary
The 2014 United States House of Representatives elections in Massachusetts were held on Tuesday, November 4, 2014 to elect the nine U.S. representatives from the Commonwealth of Massachusetts, one from each of the state's nine congressional districts. The elections coincided with the election of Massachusetts' class II U.S. senator and other elections to the United States Senate in other states and elections to the United States House of Representatives and various state and local elections, including the governor of Massachusetts.
| |||||||||||||||||||||||||
All 9 Massachusetts seats to the United States House of Representatives | |||||||||||||||||||||||||
|---|---|---|---|---|---|---|---|---|---|---|---|---|---|---|---|---|---|---|---|---|---|---|---|---|---|
| |||||||||||||||||||||||||
| |||||||||||||||||||||||||
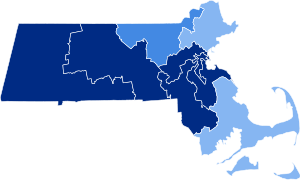
Democratic nominees were victorious in all nine Massachusetts districts in 2014, bringing the Republican losing streak in Bay State U.S. House general and special elections to a state record 101 contests in a row.[1]
Overview edit
Results of the 2014 United States House of Representatives elections in Massachusetts by district:[2]
| District | Democratic | Republican | Others | Total | Result | ||||
|---|---|---|---|---|---|---|---|---|---|
| Votes | % | Votes | % | Votes | % | Votes | % | ||
| District 1 | 167,612 | 97.96% | 0 | 0.00% | 3,498 | 2.04% | 171,110 | 100.0% | Democratic hold |
| District 2 | 169,640 | 98.20% | 0 | 0.00% | 3,105 | 1.80% | 172,745 | 100.0% | Democratic hold |
| District 3 | 139,104 | 62.96% | 81,638 | 36.95% | 204 | 0.09% | 220,946 | 100.0% | Democratic hold |
| District 4 | 184,158 | 97.91% | 0 | 0.00% | 3,940 | 2.09% | 188,098 | 100.0% | Democratic hold |
| District 5 | 182,100 | 98.29% | 0 | 0.00% | 3,160 | 1.71% | 185,260 | 100.0% | Democratic hold |
| District 6 | 149,638 | 54.97% | 111,989 | 41.14% | 10,592 | 3.89% | 272,219 | 100.0% | Democratic hold |
| District 7 | 142,133 | 98.33% | 0 | 0.00% | 2,413 | 1.67% | 144,546 | 100.0% | Democratic hold |
| District 8 | 200,644 | 98.67% | 0 | 0.00% | 2,707 | 1.33% | 203,351 | 100.0% | Democratic hold |
| District 9 | 140,413 | 54.95% | 114,971 | 44.99% | 157 | 0.06% | 255,541 | 100.0% | Democratic hold |
| Total | 1,475,442 | 81.35% | 308,598 | 17.01% | 29,776 | 1.64% | 1,813,816 | 100.0% | |
District 1 edit
The 1st congressional district is located in western and central Massachusetts. The largest Massachusetts district in area, it covers about one-third of the state and is more rural than the rest. It has the state's highest point, Mount Greylock. The district includes the cities of Springfield, West Springfield, Pittsfield, Holyoke, and Westfield. Incumbent Democrat Richard Neal, who has represented the district since 2013 and previously represented the 2nd district from 1989 to 2013, ran for re-election. He was re-elected unopposed with 98% of the vote in 2012 and the district had a PVI of D+13.
Democratic primary edit
Candidates edit
Nominee edit
- Richard Neal, incumbent U.S. Representative
General election edit
Results edit
| Party | Candidate | Votes | % | |
|---|---|---|---|---|
| Democratic | Richard Neal (incumbent) | 167,612 | 98.0 | |
| n/a | Write-ins | 3,498 | 2.0 | |
| Total votes | 171,110 | 100.0 | ||
| Democratic hold | ||||
District 2 edit
The 2nd congressional district is located in central Massachusetts. It contains the cities of Worcester, which is the second-largest city in New England after Boston, and Northampton in the Pioneer Valley. The incumbent is Democrat Jim McGovern, who has represented the district since 2013 and previously represented the 3rd district from 1997 to 2013, ran for re-election. He was re-elected unopposed with 99% of the vote in 2012 and the district had a PVI of D+8.
Democratic primary edit
Candidates edit
Nominee edit
- Jim McGovern, incumbent U.S. Representative
Republican primary edit
Candidates edit
Nominee edit
- Dan Dubrule
Due to state ballot law, Dubrule ran as a write-in candidate in the general election.[4]
General election edit
Results edit
| Party | Candidate | Votes | % | |
|---|---|---|---|---|
| Democratic | Jim McGovern (incumbent) | 169,640 | 98.2 | |
| n/a | Write-ins | 3,105 | 1.8 | |
| Total votes | 172,745 | 100.0 | ||
| Democratic hold | ||||
District 3 edit
The 3rd congressional district is located in northeastern and central Massachusetts. It contains the Merrimack valley including Lowell, Lawrence and Haverhill. TIncumbent Democrat Niki Tsongas, who has represented the district since 2013 and previously represented the 5th district from 2007 to 2013, ran for re-election. She was re-elected with 66% of the vote in 2012 and the district had a PVI of D+6.
Democratic primary edit
Candidates edit
Nominee edit
- Niki Tsongas, incumbent U.S. Representative
Republican primary edit
Candidates edit
Nominee edit
- Ann Wofford
General election edit
Results edit
| Party | Candidate | Votes | % | |
|---|---|---|---|---|
| Democratic | Niki Tsongas (incumbent) | 139,104 | 63.0 | |
| Republican | Ann Wofford | 81,638 | 36.9 | |
| n/a | Write-ins | 204 | 0.1 | |
| Total votes | 220,946 | 100.0 | ||
| Democratic hold | ||||
District 4 edit
The 4th congressional district is located mostly in southern Massachusetts. It contains Bristol, Middlesex, Norfolk, Plymouth and Worcester counties. Incumbent Democrat Joseph P. Kennedy III, who had represented the district since 2013, ran for re-election. He was elected with 61% of the vote in 2012 and the district had a PVI of D+6.
Democratic primary edit
Candidates edit
Nominee edit
- Joe Kennedy III, incumbent U.S. Representative
General election edit
Results edit
| Party | Candidate | Votes | % | |
|---|---|---|---|---|
| Democratic | Joe Kennedy III (incumbent) | 184,158 | 97.9 | |
| n/a | Write-ins | 3,940 | 2.1 | |
| Total votes | 188,098 | 100.0 | ||
| Democratic hold | ||||
District 5 edit
The 5th congressional district is located in eastern Massachusetts. It contains Middlesex, Suffolk and Worcester counties. Incumbent Democrat Katherine Clark, who had represented the district since 2013, ran for re-election. She was elected with 66% of the vote in a special election in 2013 to succeed Ed Markey and the district had a PVI of D+14.
Democratic primary edit
Candidates edit
Nominee edit
- Katherine Clark, incumbent U.S. Representative
Eliminated in primary edit
- Sheldon Schwartz
Results edit
| Party | Candidate | Votes | % | |
|---|---|---|---|---|
| Democratic | Katherine Clark (incumbent) | 57,014 | 81.2 | |
| Democratic | Sheldon Schwartz | 13,070 | 18.6 | |
| Democratic | All others | 140 | 0.2 | |
| Total votes | 70,224 | 100.0 | ||
Republican primary edit
Candidates edit
Withdrawn edit
- Mike Stopa
General election edit
Results edit
| Party | Candidate | Votes | % | |
|---|---|---|---|---|
| Democratic | Katherine Clark (incumbent) | 182,100 | 98.3 | |
| n/a | Write-ins | 3,159 | 1.7 | |
| Total votes | 185,259 | 100.0 | ||
| Democratic hold | ||||
District 6 edit
The 6th congressional district is located in northeastern Massachusetts. It contains most of Essex County, including the North Shore and Cape Ann. Incumbent Democrat John F. Tierney, who had represented the district since 1997, ran for re-election. He was re-elected with 48% of the vote in 2012 and the district had a PVI of D+4.
Democratic primary edit
Candidates edit
Nominee edit
- Seth Moulton, Marine Veteran and military commentator
Eliminated in primary edit
- Marisa DeFranco, immigration attorney
- John Devine
- John Gutta[6]
- John F. Tierney, incumbent U.S. Representative
Declined edit
- Kim Driscoll, Mayor of Salem[7]
- John D. Keenan, state representative
- Steven Walsh, state representative
Polling edit
| Poll source | Date(s) administered |
Sample size |
Margin of error |
John F. Tierney |
Marisa DeFranco |
John Devine |
John Gutta |
Seth Moulton |
Undecided |
|---|---|---|---|---|---|---|---|---|---|
| Remington | September 3–6, 2014 | 777 | ±3.53% | 43% | 4% | 1% | 1% | 42% | 9% |
| Public Policy Polling (D-Moulton) | September 2–3, 2014 | 592 | ± 4% | 45% | — | — | — | 47% | 8% |
| Emerson College | September 2–4, 2014 | 343 | ±5.25% | 47% | 4% | 1% | — | 44% | 6% |
| Emerson College | June 12–18, 2014 | — | — | 59% | 9% | 2% | — | 17% | 13% |
| Emerson College | April 3–7, 2014 | — | — | 64% | 10% | — | — | 10% | 14% |
| DCCC | March 26–27, 2014 | 402 | ±4.9% | 64% | — | — | — | 17% | 20% |
Results edit
Moulton defeated Tierney in the primary.[8]
| Party | Candidate | Votes | % | |
|---|---|---|---|---|
| Democratic | Seth Moulton | 34,575 | 50.8 | |
| Democratic | John F. Tierney (incumbent) | 28,912 | 40.1 | |
| Democratic | Marisa DeFranco | 4,293 | 6.0 | |
| Democratic | John Devine | 1,527 | 2.1 | |
| Democratic | John Gutta | 691 | 1.0 | |
| Total votes | 74,170 | 100.0 | ||
Republican primary edit
Candidates edit
Nominee edit
- Richard Tisei, former minority leader of the Massachusetts Senate, nominee for lieutenant governor in 2010 and nominee for this seat in 2012[6]
General election edit
Polling edit
| Poll source | Date(s) administered |
Sample size |
Margin of error |
Seth Moulton (D) |
Richard Tisei (R) |
Chris Stockwell (I) |
Other | Undecided |
|---|---|---|---|---|---|---|---|---|
| Emerson College | October 26–29, 2014 | 400 | ± 4.85% | 40% | 42% | 3% | 15% | |
| 0ptimus | October 22–25, 2014 | 1,807 | ± 2% | 41% | 43% | 12% | — | 6% |
| 0ptimus | October 16–19, 2014 | 2,994 | ± 1.77% | 48% | 46% | — | — | 6% |
| GarinHartYang/HMP | October 16–17, 2014 | 406 | ± 5% | 47% | 36% | 9% | — | 8% |
| Emerson College | October 13–14, 2014 | 400 | ± 4.85% | 40% | 43% | 2% | — | 10% |
| 0ptimus | October 6–9, 2014 | 6,929 | ± ? | 45% | 47% | — | — | 8% |
| Voter Consumer Research | October 6–9, 2014 | 400 | ± 4.9% | 42% | 44% | — | 14% | |
| Emerson College | September 26–29, 2014 | 429 | ± 4.68% | 39% | 41% | 3% | — | 17% |
| GarinHartYang/HMP | September 24–27, 2014 | 400 | ± 5% | 43% | 33% | 11% | — | 13% |
| Tarrance Group (R-Tisei) | September 23–25, 2014 | 400 | ± 4.9% | 40% | 41% | — | 9% | 10% |
| MassINC/WBUR | September 22–24, 2014 | 400 | ± 4.9% | 47% | 39% | — | 1% | 14% |
| Municipoll | September 12–14, 2014 | 490 | ± 4.4% | 49% | 31% | — | — | 20% |
| DCCC (D) | September 13, 2014 | 432 | ± 4.7% | 49% | 41% | — | — | 10% |
| Emerson College | September 2–4, 2014 | 500 | ± 4.33% | 44% | 36% | — | — | 20% |
| Poll source | Date(s) administered |
Sample size |
Margin of error |
John F. Tierney (D) |
Richard Tisei (R) |
Other | Undecided |
|---|---|---|---|---|---|---|---|
| Emerson College | September 2–4, 2014 | 500 | ± 4.33% | 43% | 51% | — | 6% |
| Emerson College | June 12–18, 2014 | 253 | ± 6.12% | 40% | 45% | — | 15% |
| Emerson College | April 3–7, 2014 | 326 | ± 5.4% | 44% | 44% | — | 13% |
Results edit
| Party | Candidate | Votes | % | |
|---|---|---|---|---|
| Democratic | Seth Moulton | 149,638 | 55.0 | |
| Republican | Richard Tisei | 111,989 | 41.1 | |
| Independent | Chris Stockwell | 10,373 | 3.8 | |
| n/a | Write-ins | 219 | 0.1 | |
| Total votes | 272,219 | 100.0 | ||
| Democratic hold | ||||
District 7 edit
The 7th congressional district is located in eastern Massachusetts. It contains the northern three-quarters of the city of Boston, the city of Somerville and parts of the city of Cambridge. Incumbent Democrat Mike Capuano, who had represented the district since 2013 and previously represented the 8th district from 1999 to 2013, ran for re-election. He was re-elected with 83% of the vote in 2012 and the district had a PVI of D+31.
Capuano considered running for Governor of Massachusetts in the 2014 election,[9] however, he instead chose to run for re-election to the House.[10]
Democratic primary edit
Candidates edit
Nominee edit
- Mike Capuano, incumbent U.S. Representative
Green primary edit
Candidates edit
Disqualified edit
- Jason Lowenthal
General election edit
Lowenthal, the only minor party candidate to file to run, was told the 3,000 signatures on his petition were invalid because the petitions he was given and used to collect the signatures were for the primary election, rather than the petition designated for the general election.
Results edit
| Party | Candidate | Votes | % | |
|---|---|---|---|---|
| Democratic | Mike Capuano (incumbent) | 142,133 | 98.3 | |
| n/a | Write-ins | 2,413 | 1.7 | |
| Total votes | 144,546 | 100.0 | ||
| Democratic hold | ||||
District 8 edit
The 8th congressional district is located in eastern Massachusetts. It contains the southern quarter of the city of Boston and many of its southern suburbs. Incumbent Democrat Stephen Lynch, who had represented the district since 2013 and previously represented the 9th district from 2001 to 2013, ran for re-election. He was re-elected with 76% of the vote in 2012 and the district had a PVI of D+6.
Democratic primary edit
Candidates edit
Nominee edit
- Stephen Lynch, incumbent U.S. Representative
General election edit
Results edit
| Party | Candidate | Votes | % | |
|---|---|---|---|---|
| Democratic | Stephen Lynch (incumbent) | 200,644 | 98.7 | |
| n/a | Write-ins | 2,707 | 1.3 | |
| Total votes | 203,351 | 100.0 | ||
| Democratic hold | ||||
District 9 edit
The 9th congressional district is located in eastern Massachusetts, including Cape Cod and the South Coast. It contains all of Barnstable, Dukes and Nantucket counties and parts of Bristol and Plymouth counties. Incumbent Democrat Bill Keating, who had represented the district since 2013 and previously represented the 10th district from 2011 to 2013, ran for re-election. He was re-elected with 59% of the vote in 2012 and the district had a PVI of D+5.
Democratic primary edit
Candidates edit
Nominee edit
- Bill Keating, incumbent U.S. Representative
Republican primary edit
Candidates edit
Nominee edit
- John Chapman, former State Industrial Accidents Commissioner, Reagan White House Aide and Attorney
Eliminated in primary edit
- Mark Alliegro, biologist[11]
- Vincent Cogliano Jr, Plymouth County GOP Chair
- Dan Shores, attorney[12]
Results edit
| Party | Candidate | Votes | % | |
|---|---|---|---|---|
| Republican | John Chapman | 9,567 | 32.3 | |
| Republican | Mark Alliegro | 9,049 | 30.6 | |
| Republican | Daniel Shores | 6,973 | 23.6 | |
| Republican | Vincent Anthony Cogliano, Jr. | 3,917 | 13.2 | |
| Republican | All Others | 69 | 0.2 | |
| Total votes | 29,575 | 100.0 | ||
General election edit
Polling edit
| Poll source | Date(s) administered |
Sample size |
Margin of error |
William R. Keating (D) |
John Chapman (R) |
Other | Undecided |
|---|---|---|---|---|---|---|---|
| Emerson College | October 26–29, 2014 | 400 | ± 4.85% | 46% | 41% | 13% | |
| Emerson College | October 6–7, 2014 | 343 | ± 5.25% | 40% | 45% | — | 16% |
Results edit
| Party | Candidate | Votes | % | |
|---|---|---|---|---|
| Democratic | Bill Keating (incumbent) | 140,413 | 54.9 | |
| Republican | John Chapman | 114,971 | 45.0 | |
| n/a | Write-ins | 157 | 0.1 | |
| Total votes | 255,541 | 100.0 | ||
| Democratic hold | ||||
References edit
- ^ Ostermeier, Eric (November 6, 2014). "Massachusetts Republican US House Losing Streak Tops 100". Smart Politics.
- ^ Haas, Karen L. (March 9, 2015). "Statistics of the Congressional Election of November 4, 2014". Clerk of the U.S. House of Representatives. Retrieved October 28, 2019.
- ^ a b c d e f g h i "PD43+ » Search Elections".
- ^ Massachusetts Libertarian Victory Fundraiser held on Saturday May 3rd 2014 - YouTube
- ^ a b "PD43+ » Search Elections". Massachusetts Election Division. Retrieved October 25, 2014.
- ^ a b "Race against Tierney picks up momentum » Local News » SalemNews.com, Salem, MA". Salemnews.com. July 18, 2013. Retrieved July 22, 2013.
- ^ "Benton: An uphill race for Moulton » Opinion » SalemNews.com, Salem, MA". Salemnews.com. Retrieved July 22, 2013.
- ^ "Tierney concedes to Moulton in Democratic primary". The Boston Globe. September 9, 2014. Retrieved September 9, 2014.
- ^ Massachusetts (May 14, 2013). "Frustrated in Congress, Michael Capuano still weighing Massachusetts gubernatorial run". masslive.com. Retrieved July 22, 2013.
- ^ Frank Phillips (September 26, 2013). "Representative Michael Capuano will not run for governor". The Boston Globe. Retrieved September 26, 2013.
- ^ Massachusetts. "Scientist and Educator Mark Alliegro Announces Candidacy for Massachusetts' 9th Congressional District". markalliegroforcongress.org. Archived from the original on January 9, 2014. Retrieved January 7, 2014.
- ^ Politics1 - Online Guide to Massachusetts Elections, Candidates & Politics
External links edit
- U.S. House elections in Massachusetts, 2014 at Ballotpedia
- Campaign contributions at OpenSecrets