


Summary
The 2004 United States presidential election in Maryland took place on November 2, 2004, and was part of the 2004 United States presidential election. Voters chose 10 representatives, or electors to the Electoral College, who voted for president and vice president.
| ||||||||||||||||||||||||||
| ||||||||||||||||||||||||||
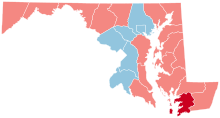
 County Results
| ||||||||||||||||||||||||||
| ||||||||||||||||||||||||||
Maryland was won by Democratic nominee John Kerry by a 12.98% margin of victory. Prior to the election, all twelve news organizations considered this a state Kerry would win, or otherwise considered as a safe blue state. The last Republican to carry the state in a presidential election was Bush's father George H. W. Bush in 1988. As of the 2020 election, this is the last time a Republican presidential candidate won more than 40% of the vote in Maryland, the only time a Republican presidential candidate received more than a million votes in Maryland, and the last time a Democratic presidential nominee has failed to both break 60% of the vote and win by less than a 15% margin in Maryland. This is also the last time that Maryland shifted rightward compared to the previous election. Bush's 1,024,703 votes is the most received by a Republican presidential candidate in the state's history.
Primaries edit
Campaign edit
Predictions edit
There were 12 news organizations who made state-by-state predictions of the election. Here are their last predictions before election day.[1]
| Source | Ranking |
|---|---|
| D.C. Political Report | Solid D |
| Cook Political Report | Likely D |
| Research 2000 | Solid D |
| Zogby International | Likely D |
| Washington Post | Likely D |
| Washington Dispatch | Likely D |
| Washington Times | Solid D |
| The New York Times | Solid D |
| CNN | Likely D |
| Newsweek | Solid D |
| Associated Press | Solid D |
| Rasmussen Reports | Likely D |
Polling edit
Kerry won every pre-election poll. The final 3 poll average showed Kerry leading 52% to 42%.[2]
Fundraising edit
Bush raised $4,174,964.[3] Kerry raised $7,553,542, which was 4% of the total money raised by Kerry in 2004.[4]
Advertising and visits edit
Neither campaign advertised or visited this state during the fall election.[5][6]
Analysis edit
Bush did win most of the counties in Maryland, but he lost the central part of the state (Washington DC suburbs and Baltimore), where most of the population is. The middle section is very urban and includes a large number of African Americans, many of whom are affluent (specifically in the Democratic stronghold of Prince George's County). Bush dominated Western Maryland and the state's Eastern Shore, which are very rural, but he carried only two congressional districts (see below). However, Kerry's margin of victory was slightly less than in 2000, when Gore won by 16.39%. As of 2020, this marks the last time in which the Democratic candidate won less than 7 counties. [7] This also marks the only time since 1880 in which Maryland gave a majority of its vote to a candidate that lost both the popular and electoral vote.[8]
Results edit
| 2004 United States presidential election in Maryland | ||||||
|---|---|---|---|---|---|---|
| Party | Candidate | Running mate | Votes | Percentage | Electoral votes | |
| Democratic Party | John Kerry | John Edwards | 1,334,493 | 55.91% | 10 | |
| Republican Party | George W. Bush (Incumbent) | Dick Cheney (Incumbent) | 1,024,703 | 42.93% | 0 | |
| Populist Party[9] | Ralph Nader | Peter Camejo | 11,854 | 0.50% | 0 | |
| Libertarian Party | Michael Badnarik | Richard Campagna | 6,094 | 0.26% | 0 | |
| Green Party | David Cobb | Patricia LaMarche | 3,632 | 0.15% | 0 | |
| Constitution Party | Michael Peroutka | Chuck Baldwin | 3,421 | 0.14% | 0 | |
| Write Ins | 2,481 | 0.11% | 0 | |||
| Totals | 2,386,678 | 100.00% | 10 | |||
| Voter turnout (Voting Age population) | 59% | |||||
Results by county edit
| County | John Kerry Democratic |
George W. Bush Republican |
Various candidates Other parties |
Margin | Total votes cast[10] | ||||
|---|---|---|---|---|---|---|---|---|---|
| # | % | # | % | # | % | # | % | ||
| Allegany | 10,576 | 35.42% | 18,980 | 63.57% | 299 | 1.01% | -8,404 | -28.15% | 29,855 |
| Anne Arundel | 103,324 | 43.11% | 133,231 | 55.59% | 3,112 | 1.30% | -29,907 | -12.48% | 239,667 |
| Baltimore | 182,474 | 51.62% | 166,051 | 46.98% | 4,954 | 1.40% | 16,423 | 4.64% | 353,479 |
| Baltimore City | 175,022 | 81.95% | 36,230 | 16.96% | 2,311 | 1.09% | 138,792 | 64.99% | 213,563 |
| Calvert | 15,967 | 40.58% | 23,017 | 58.49% | 367 | 0.93% | -7,050 | -17.91% | 39,351 |
| Caroline | 3,810 | 33.55% | 7,396 | 65.13% | 150 | 1.32% | -3,586 | -31.58% | 11,356 |
| Carroll | 22,974 | 28.95% | 55,275 | 69.66% | 1,100 | 1.39% | -32,301 | -40.71% | 79,349 |
| Cecil | 14,680 | 38.97% | 22,556 | 59.87% | 438 | 1.16% | -7,876 | -20.90% | 37,674 |
| Charles | 29,354 | 50.40% | 28,442 | 48.84% | 445 | 0.76% | 912 | 1.56% | 58,241 |
| Dorchester | 5,411 | 40.57% | 7,801 | 58.48% | 127 | 0.95% | -2,390 | -17.91% | 13,339 |
| Frederick | 39,503 | 39.27% | 59,934 | 59.58% | 1,157 | 1.15% | -20,431 | -20.31% | 100,594 |
| Garrett | 3,291 | 26.36% | 9,085 | 72.77% | 108 | 0.87% | -5,794 | -46.41% | 12,484 |
| Harford | 39,685 | 35.20% | 71,565 | 63.48% | 1,478 | 1.32% | -31,880 | -28.28% | 112,728 |
| Howard | 72,257 | 54.00% | 59,724 | 44.63% | 1,829 | 1.37% | 12,533 | 9.37% | 133,810 |
| Kent | 4,278 | 46.07% | 4,900 | 52.77% | 107 | 1.16% | -622 | -6.70% | 9,285 |
| Montgomery | 273,936 | 65.97% | 136,334 | 32.83% | 4,955 | 1.20% | 137,602 | 33.14% | 415,225 |
| Prince George's | 260,532 | 81.81% | 55,532 | 17.44% | 2,410 | 0.75% | 205,000 | 64.37% | 318,474 |
| Queen Anne's | 7,070 | 32.44% | 14,489 | 66.48% | 235 | 1.08% | -7,419 | -34.04% | 21,794 |
| Somerset | 4,034 | 44.85% | 4,884 | 54.30% | 76 | 0.85% | -850 | -9.45% | 8,994 |
| St. Mary's | 13,776 | 36.33% | 23,725 | 62.57% | 415 | 1.10% | -9,949 | -26.24% | 37,916 |
| Talbot | 7,367 | 39.05% | 11,288 | 59.84% | 12 | 1.11% | -3,921 | -20.79% | 18,864 |
| Washington | 20,387 | 35.21% | 36,917 | 63.76% | 600 | 1.03% | -16,530 | -28.55% | 57,904 |
| Wicomico | 15,137 | 40.36% | 21,998 | 58.66% | 368 | 0.98% | -6,861 | -18.30% | 37,503 |
| Worcester | 9,648 | 38.24% | 15,349 | 60.84% | 232 | 0.92% | -5,701 | -22.60% | 25,229 |
| Totals | 1,334,493 | 55.91% | 1,024,703 | 42.93% | 27,482 | 1.16% | 309,790 | 12.98% | 2,386,678 |
| Democratic Hold | Republican Hold Gain from Democratic |
Counties that flipped from Democratic to Republican edit
- Somerset (largest town: Princess Anne)
By congressional district edit
Kerry won 6 of 8 congressional districts.[11]
| District | Kerry | Bush | Representative |
|---|---|---|---|
| 1st | 36% | 62% | Wayne Gilchrest |
| 2nd | 54% | 45% | Dutch Ruppersberger |
| 3rd | 54% | 45% | Ben Cardin |
| 4th | 78% | 21% | Albert Wynn |
| 5th | 57% | 42% | Steny Hoyer |
| 6th | 34% | 65% | Roscoe Bartlett |
| 7th | 73% | 26% | Elijah Cummings |
| 8th | 69% | 30% | Chris Van Hollen |
Electors edit
Technically the voters of Maryland cast their ballots for electors: representatives to the Electoral College. Maryland is allocated 10 electors because it has 8 congressional districts and 2 senators. All candidates who appear on the ballot or qualify to receive write-in votes must submit a list of 10 electors, who pledge to vote for their candidate and his or her running mate. Whoever wins the majority of votes in the state is awarded all 10 electoral votes. Their chosen electors then vote for president and vice president. Although electors are pledged to their candidate and running mate, they are not obligated to vote for them. An elector who votes for someone other than his or her candidate is known as a faithless elector.
The electors of each state and the District of Columbia met on December 13, 2004, to cast their votes for president and vice president. The Electoral College itself never meets as one body. Instead the electors from each state and the District of Columbia met in their respective capitols.
The following were the members of the Electoral College from the state. All 10 were pledged for Kerry/Edwards:[12]
- Norman Conway
- Delores Kelley
- Lainey Lebow Sachs
- Pam Jackson
- Dorothy Chaney
- John Riley
- Wendy Fielde
- Daphne Bloomberg
- Tom Perez
- Gary Gensler
See also edit
References edit
- ^ http://www.dcpoliticalreport.com/members/2004/Pred2.htm#NW [permanent dead link]
- ^ "2004 Presidential Election Polls. Maryland Polls". US Election Atlas.
- ^ "George W Bush - $374,659,453 raised, '04 election cycle, Republican Party, President".
- ^ "John F Kerry - $345,826,176 raised, '04 election cycle, Democrat Party, President".
- ^ "America votes 2004: Campaign ad buys". CNN. Archived from the original on April 22, 2021. Retrieved May 27, 2022.
- ^ "America votes 2004: Candidate tracker". CNN. Retrieved May 27, 2022.
- ^ "Maryland". Google Docs. Retrieved September 4, 2022.
- ^ "Dave Leip's Atlas of U.S. Presidential Elections". uselectionatlas.org. Retrieved December 20, 2022.
- ^ "Dave Leip's Atlas of U.S. Presidential Elections".
- ^ Maryland State Board of Elections; 2004 Presidential General Election Official Results President and Vice President of the United States
- ^ "Presidential Results by Congressional District, 2000-2008 – Swing State Project".
- ^ "Current Election - Maryland State Board of Elections". Archived from the original on October 4, 2006. Retrieved October 8, 2009.
External links edit
- U.S. Election Atlas, Maryland results