


Summary
The 2004 United States presidential election in Indiana took place on November 2, 2004, and was part of the 2004 United States presidential election. Voters chose 11 representatives, or electors to the Electoral College, who voted for president and vice president.
| ||||||||||||||||||||||||||
| Turnout | 57.4% (of registered voters) 53.7% (of voting age population) | |||||||||||||||||||||||||
|---|---|---|---|---|---|---|---|---|---|---|---|---|---|---|---|---|---|---|---|---|---|---|---|---|---|---|
| ||||||||||||||||||||||||||
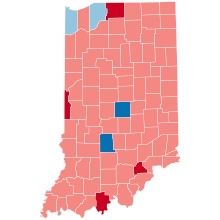
 County Results
| ||||||||||||||||||||||||||
| ||||||||||||||||||||||||||
Indiana was won by incumbent President George W. Bush by a 20.68% margin of victory. Prior to the election, all 12 news organizations considered this a state Bush would win, or otherwise considered as a safe red state, even though Democratic Senator Evan Bayh overwhelmingly won re-election on the same ballot. Indiana had not voted Democratic in a presidential election since 1964, but would buck this trend 4 years later by voting for Senator Barack Obama of neighboring Illinois.
Bush became the first Republican to win the White House without carrying Monroe County since Abraham Lincoln in 1864, as well as the first to do so without carrying Marion County since Benjamin Harrison in 1888. This is also the last time as of 2020 that Indiana voted to the right of Arkansas, Kentucky, Louisiana, Tennessee, or West Virginia.
Primaries edit
Campaign edit
Predictions edit
There were 12 news organizations who made state-by-state predictions of the election. Here are their last predictions before election day.[1]
| Source | Ranking |
|---|---|
| D.C. Political Report | Solid R |
| Associated Press | Solid R |
| CNN | Likely R |
| Cook Political Report | Solid R |
| Newsweek | Solid R |
| New York Times | Solid R |
| Rasmussen Reports | Likely R |
| Research 2000 | Solid R |
| Washington Post | Likely R |
| Washington Times | Solid R |
| Zogby International | Likely R |
| Washington Dispatch | Likely R |
Polling edit
Bush won every single pre-election poll, and won each by a double-digit margin of victory and with at least 52% of the vote. The final 3 polls averaged Bush leading 56% to 40%.[2]
Fundraising edit
Bush raised $2,491,828.[3] Kerry raised $681,272.[4]
Advertising and visits edit
Neither campaign visited or advertised in this state during the fall campaign.[5][6]
Analysis edit
Indiana has long been considered to be a Republican stronghold.[7][8] The Cook Partisan Voting Index (CPVI) rates Indiana as a R+8. Indiana was one of only ten states to support Republican Wendell Willkie in 1940.[9] On 14 occasions has the Republican candidate defeated the Democrat by a double-digit margin in the state, including six times where a Republican won the state by more than 20%.[10] In 2000 and 2004, George W. Bush won the state by a wide margin while the election was much closer overall. The state has only supported a Democrat for president five times since 1900. In 1912, Woodrow Wilson became the first Democrat to win the state in the 20th Century, with 43% of the vote. 20 years later in 1932, Franklin D. Roosevelt won the state with 55% of the vote over incumbent Republican Herbert Hoover. Roosevelt won the state again in 1936. In 1964, 56% of voters supported Democrat Lyndon B. Johnson over Republican Barry Goldwater. Statistically, Indiana is more of a stronghold for Republican presidential candidates than for candidates elected to state government. Whereas only five Democratic presidential nominees have carried Indiana since 1900, eleven Democrats were elected governor during that time. Before Mitch Daniels became governor in 2005, Democrats had held the office for 16 consecutive years.
Historically, Republicans have been strongest in the eastern and central portions of the state, while Democrats have been strongest in the northwestern part of the state. Occasionally, certain counties in the southern part of the state will vote Democratic. Marion County, Indiana's most populated county, supported the Republican candidates from 1968 to 2000, before backing the Democrats in the 2004 and subsequent 2008, and 2012 elections. Indiana's second most populated county, Lake County, is a strong supporter of the Democratic party that has not voted for a Republican since 1972.[10] In 2005, the Bay Area Center for Voting Research rated the most liberal and conservative cities in the United States on voting statistics in the 2004 presidential election, based on 237 cities with populations of more than 100,000. Five Indiana cities were mentioned in the study. On the liberal side, Gary was ranked second and South Bend came in at 83. Regarding conservative cities, Fort Wayne was 44th, Evansville was 60th and Indianapolis was 82nd on the list.[11]
As of the 2020 presidential election[update], this is the last election in which St. Joseph County voted for the Republican candidate.
Results edit
| Party | Candidate | Votes | % | ±% | |
|---|---|---|---|---|---|
| Republican | George Walker Bush (Incumbent) | 1,479,438 | 59.94% | ||
| Democratic | John Forbes Kerry | 969,011 | 39.26% | ||
| Libertarian | Michael Badnarik | 18,058 | 0.73% | ||
| Write In | Ralph Nader | 1,328 | 0.1% | ||
| Write In | David Cobb | 102 | 0.0% | ||
| Write In | John Joseph Kennedy | 37 | 0.0% | ||
| Write In | Walt Brown | 22 | 0.0% | ||
| Write In | Lawson Mitchell Bone | 6 | 0.0% | ||
| Majority | 510,427 | 20.68% | |||
| Turnout | 2,468,002 | 58% | |||
By county edit
| County | George W. Bush Republican |
John Kerry Democratic |
Various candidates Other parties |
Margin | Total | ||||
|---|---|---|---|---|---|---|---|---|---|
| # | % | # | % | # | % | # | % | ||
| Adams | 9,734 | 72.97% | 3,512 | 26.33% | 94 | 0.70% | 6,222 | 46.64% | 13,340 |
| Allen | 82,013 | 63.28% | 46,710 | 36.04% | 886 | 0.68% | 35,303 | 27.24% | 129,609 |
| Bartholomew | 19,093 | 66.96% | 9,191 | 32.23% | 231 | 0.81% | 9,902 | 34.73% | 28,515 |
| Benton | 2,797 | 70.07% | 1,135 | 28.43% | 60 | 1.50% | 1,662 | 41.64% | 3,992 |
| Blackford | 3,447 | 64.07% | 1,903 | 35.37% | 30 | 0.56% | 1,544 | 28.70% | 5,380 |
| Boone | 17,055 | 74.48% | 5,636 | 24.61% | 207 | 0.91% | 11,419 | 49.87% | 22,898 |
| Brown | 4,512 | 61.56% | 2,730 | 37.24% | 88 | 1.20% | 1,782 | 24.32% | 7,330 |
| Carroll | 5,868 | 67.93% | 2,689 | 31.13% | 81 | 0.93% | 3,179 | 36.80% | 8,638 |
| Cass | 9,480 | 68.05% | 4,315 | 30.97% | 136 | 0.97% | 5,165 | 37.08% | 13,931 |
| Clark | 24,495 | 57.86% | 17,648 | 41.68% | 194 | 0.46% | 6,847 | 16.18% | 42,337 |
| Clay | 7,361 | 68.26% | 3,333 | 30.91% | 89 | 0.82% | 4,028 | 37.35% | 10,783 |
| Clinton | 8,471 | 71.32% | 3,335 | 28.08% | 71 | 0.60% | 5,136 | 43.24% | 11,877 |
| Crawford | 2,609 | 57.04% | 1,932 | 42.24% | 33 | 0.72% | 677 | 14.80% | 4,574 |
| Daviess | 7,936 | 74.87% | 2,573 | 24.28% | 90 | 0.84% | 5,363 | 50.59% | 10,599 |
| Dearborn | 14,231 | 67.87% | 6,596 | 31.46% | 142 | 0.68% | 7,635 | 36.41% | 20,969 |
| Decatur | 7,499 | 73.53% | 2,621 | 25.70% | 79 | 0.77% | 4,878 | 47.83% | 10,199 |
| DeKalb | 10,468 | 67.96% | 4,810 | 31.23% | 125 | 0.81% | 5,658 | 36.73% | 15,403 |
| Delaware | 27,064 | 56.46% | 20,436 | 42.63% | 439 | 0.92% | 6,628 | 13.83% | 47,939 |
| Dubois | 11,726 | 68.71% | 5,210 | 30.53% | 130 | 0.76% | 6,516 | 38.18% | 17,066 |
| Elkhart | 42,967 | 70.00% | 17,966 | 29.27% | 447 | 0.73% | 25,001 | 40.73% | 61,380 |
| Fayette | 5,761 | 60.85% | 3,626 | 38.30% | 81 | 0.86% | 2,135 | 22.55% | 9,468 |
| Floyd | 19,877 | 58.65% | 13,857 | 40.89% | 156 | 0.46% | 6,020 | 17.76% | 33,890 |
| Fountain | 5,260 | 67.40% | 2,477 | 31.74% | 67 | 0.86% | 2,783 | 35.66% | 7,804 |
| Franklin | 6,977 | 69.83% | 2,925 | 29.27% | 90 | 0.90% | 4,052 | 40.56% | 9,992 |
| Fulton | 6,027 | 69.25% | 2,607 | 29.96% | 69 | 0.79% | 3,420 | 39.29% | 8,703 |
| Gibson | 9,133 | 62.49% | 5,378 | 36.80% | 103 | 0.70% | 3,755 | 25.69% | 14,614 |
| Grant | 18,769 | 68.35% | 8,509 | 30.99% | 182 | 0.66% | 10,260 | 37.36% | 27,460 |
| Greene | 8,609 | 64.48% | 4,606 | 34.50% | 137 | 1.02% | 4,003 | 29.98% | 13,352 |
| Hamilton | 77,887 | 74.24% | 26,388 | 25.15% | 631 | 0.60% | 51,499 | 49.09% | 104,906 |
| Hancock | 20,771 | 74.54% | 6,912 | 24.80% | 184 | 0.66% | 13,859 | 49.74% | 27,867 |
| Harrison | 11,015 | 63.63% | 6,171 | 35.65% | 124 | 0.72% | 4,844 | 27.98% | 17,310 |
| Hendricks | 38,430 | 73.48% | 13,548 | 25.90% | 324 | 0.62% | 24,882 | 47.58% | 52,302 |
| Henry | 13,137 | 64.07% | 7,176 | 35.00% | 191 | 0.93% | 5,961 | 29.07% | 20,504 |
| Howard | 23,714 | 64.06% | 12,998 | 35.11% | 309 | 0.83% | 10,716 | 28.95% | 37,021 |
| Huntington | 11,617 | 74.34% | 3,877 | 24.81% | 133 | 0.85% | 7,740 | 49.53% | 15,627 |
| Jackson | 11,083 | 67.96% | 5,092 | 31.22% | 134 | 0.82% | 5,991 | 36.74% | 16,309 |
| Jasper | 8,056 | 68.02% | 3,678 | 31.05% | 110 | 0.93% | 4,378 | 36.97% | 11,844 |
| Jay | 5,427 | 65.93% | 2,740 | 33.28% | 65 | 0.79% | 2,687 | 32.65% | 8,232 |
| Jefferson | 7,763 | 59.85% | 5,117 | 39.45% | 91 | 0.70% | 2,646 | 20.40% | 12,971 |
| Jennings | 6,864 | 65.27% | 3,538 | 33.64% | 115 | 1.09% | 3,326 | 31.63% | 10,517 |
| Johnson | 37,765 | 73.68% | 13,109 | 25.58% | 381 | 0.75% | 24,656 | 48.10% | 51,255 |
| Knox | 9,990 | 63.44% | 5,649 | 35.88% | 107 | 0.68% | 4,341 | 27.56% | 15,746 |
| Kosciusko | 22,136 | 78.05% | 5,977 | 21.08% | 247 | 0.87% | 16,159 | 56.97% | 28,360 |
| LaGrange | 6,430 | 71.42% | 2,523 | 28.02% | 50 | 0.56% | 3,907 | 43.40% | 9,003 |
| Lake | 71,903 | 38.24% | 114,743 | 61.03% | 1,376 | 0.73% | -42,840 | -22.79% | 188,022 |
| LaPorte | 20,916 | 49.09% | 21,114 | 49.56% | 576 | 1.36% | -198 | -0.47% | 42,606 |
| Lawrence | 12,207 | 68.97% | 5,346 | 30.21% | 145 | 0.82% | 6,861 | 38.76% | 17,698 |
| Madison | 32,526 | 59.29% | 21,882 | 39.89% | 447 | 0.82% | 10,644 | 19.40% | 54,855 |
| Marion | 156,072 | 48.65% | 162,249 | 50.57% | 2,517 | 0.78% | -6,177 | -1.92% | 320,838 |
| Marshall | 12,074 | 67.78% | 5,593 | 31.40% | 147 | 0.83% | 6,481 | 36.38% | 17,814 |
| Martin | 3,414 | 68.33% | 1,522 | 30.46% | 60 | 1.20% | 1,892 | 37.87% | 4,996 |
| Miami | 9,600 | 70.44% | 3,886 | 28.51% | 142 | 1.05% | 5,714 | 41.93% | 13,628 |
| Monroe | 22,834 | 45.25% | 26,965 | 53.43% | 668 | 1.32% | -4,131 | -8.18% | 50,467 |
| Montgomery | 10,901 | 74.93% | 3,536 | 24.31% | 111 | 0.76% | 7,365 | 50.62% | 14,548 |
| Morgan | 19,197 | 73.75% | 6,650 | 25.55% | 182 | 0.70% | 12,547 | 48.20% | 26,029 |
| Newton | 3,757 | 64.24% | 2,032 | 34.75% | 59 | 1.01% | 1,725 | 29.49% | 5,848 |
| Noble | 10,859 | 69.26% | 4,703 | 30.00% | 117 | 0.74% | 6,156 | 39.26% | 15,679 |
| Ohio | 1,796 | 60.72% | 1,139 | 38.51% | 23 | 0.78% | 657 | 22.21% | 2,958 |
| Orange | 5,683 | 65.68% | 2,885 | 33.34% | 84 | 0.97% | 2,798 | 32.34% | 8,652 |
| Owen | 5,000 | 65.75% | 2,536 | 33.35% | 68 | 0.89% | 2,464 | 32.40% | 7,604 |
| Parke | 4,550 | 65.27% | 2,362 | 33.88% | 59 | 0.85% | 2,188 | 31.39% | 6,971 |
| Perry | 4,137 | 49.75% | 4,131 | 49.68% | 47 | 0.56% | 6 | 0.07% | 8,315 |
| Pike | 3,745 | 60.29% | 2,418 | 38.92% | 49 | 0.79% | 1,327 | 21.37% | 6,212 |
| Porter | 34,794 | 53.63% | 29,388 | 45.30% | 691 | 1.06% | 5,406 | 8.33% | 64,873 |
| Posey | 7,833 | 65.35% | 4,085 | 34.08% | 68 | 0.57% | 3,748 | 31.27% | 11,986 |
| Pulaski | 3,797 | 67.63% | 1,750 | 31.17% | 67 | 1.20% | 2,047 | 36.46% | 5,614 |
| Putnam | 8,908 | 67.81% | 4,103 | 31.23% | 125 | 0.95% | 4,805 | 36.58% | 13,136 |
| Randolph | 7,172 | 64.66% | 3,812 | 34.37% | 108 | 0.97% | 3,360 | 30.29% | 11,092 |
| Ripley | 8,224 | 69.49% | 3,510 | 29.66% | 100 | 0.84% | 4,714 | 39.83% | 11,834 |
| Rush | 5,363 | 72.27% | 2,000 | 26.95% | 58 | 0.78% | 3,363 | 45.32% | 7,421 |
| Scott | 4,793 | 55.24% | 3,822 | 44.05% | 62 | 0.71% | 971 | 11.19% | 8,677 |
| Shelby | 11,397 | 71.11% | 4,519 | 28.20% | 111 | 0.69% | 6,878 | 42.91% | 16,027 |
| Spencer | 5,934 | 59.79% | 3,920 | 39.50% | 70 | 0.70% | 2,014 | 20.29% | 9,924 |
| St. Joseph | 55,254 | 50.87% | 52,637 | 48.46% | 728 | 0.67% | 2,617 | 2.41% | 108,619 |
| Starke | 4,846 | 54.22% | 3,987 | 44.61% | 104 | 1.16% | 859 | 9.61% | 8,937 |
| Steuben | 8,433 | 65.35% | 4,345 | 33.67% | 127 | 0.99% | 4,088 | 31.68% | 12,905 |
| Sullivan | 4,999 | 59.55% | 3,341 | 39.80% | 54 | 0.64% | 1,658 | 19.75% | 8,394 |
| Switzerland | 2,161 | 58.87% | 1,479 | 40.29% | 31 | 0.84% | 682 | 18.58% | 3,671 |
| Tippecanoe | 30,897 | 59.01% | 20,818 | 39.76% | 645 | 1.23% | 10,079 | 19.25% | 52,360 |
| Tipton | 5,628 | 71.31% | 2,203 | 27.91% | 61 | 0.77% | 3,425 | 43.40% | 7,892 |
| Union | 2,266 | 67.76% | 1,045 | 31.25% | 33 | 0.99% | 1,221 | 36.51% | 3,344 |
| Vanderburgh | 41,463 | 58.68% | 28,767 | 40.72% | 424 | 0.60% | 12,696 | 17.96% | 70,654 |
| Vermillion | 3,536 | 50.39% | 3,424 | 48.80% | 57 | 0.81% | 112 | 1.59% | 7,017 |
| Vigo | 20,988 | 52.81% | 18,426 | 46.36% | 330 | 0.83% | 2,562 | 6.45% | 39,744 |
| Wabash | 9,607 | 70.63% | 3,920 | 28.82% | 75 | 0.55% | 5,687 | 41.81% | 13,602 |
| Warren | 2,565 | 64.77% | 1,356 | 34.24% | 39 | 0.98% | 1,209 | 30.53% | 3,960 |
| Warrick | 16,930 | 65.05% | 8,980 | 34.51% | 115 | 0.44% | 7,950 | 30.54% | 26,025 |
| Washington | 6,915 | 63.56% | 3,879 | 35.65% | 86 | 0.79% | 3,036 | 27.91% | 10,880 |
| Wayne | 16,586 | 59.97% | 10,775 | 38.96% | 296 | 1.07% | 5,811 | 21.01% | 27,657 |
| Wells | 9,168 | 74.21% | 3,112 | 25.19% | 74 | 0.60% | 6,056 | 49.02% | 12,354 |
| White | 6,974 | 67.28% | 3,277 | 31.61% | 115 | 1.11% | 3,697 | 35.67% | 10,366 |
| Whitley | 9,512 | 70.56% | 3,880 | 28.78% | 89 | 0.66% | 5,632 | 41.78% | 13,481 |
| Totals | 1,479,438 | 59.94% | 969,011 | 39.26% | 19,553 | 0.79% | 510,427 | 20.68% | 2,468,002 |
| Democratic Hold Gain from Republican | Republican Hold Gain from Democratic |
Counties that flipped Democratic to Republican edit
- Perry (Largest city: Tell City)
- Scott (Largest city: Scottsburg)
- St. Joseph (Largest city: South Bend)
- Vermillion (Largest city: Clinton)
Counties that flipped from Republican to Democratic edit
- Marion (Largest city: Indianapolis)
- Monroe (Largest city: Bloomington)
By congressional district edit
Bush won 7 of 9 congressional districts.[14]
| District | Bush | Kerry | Representative |
|---|---|---|---|
| 1st | 44% | 55% | Pete Visclosky |
| 2nd | 56% | 43% | Chris Chocola |
| 3rd | 68% | 31% | Mark Souder |
| 4th | 69% | 30% | Steve Buyer |
| 5th | 71% | 28% | Dan Burton |
| 6th | 64% | 35% | Mike Pence |
| 7th | 42% | 58% | Julia Carson |
| 8th | 62% | 38% | John Hostettler |
| 9th | 59% | 40% | Baron Hill |
| Mike Sodrel |
Electors edit
Technically the voters of Indiana cast their ballots for electors: representatives to the Electoral College. Indiana is allocated 11 electors because it has 9 congressional districts and 2 senators. All candidates who appear on the ballot or qualify to receive write-in votes must submit a list of 11 electors, who pledge to vote for their candidate and his or her running mate. Whoever wins the majority of votes in the state is awarded all 11 electoral votes. Their chosen electors then vote for president and vice president. Although electors are pledged to their candidate and running mate, they are not obligated to vote for them. An elector who votes for someone other than his or her candidate is known as a faithless elector.
The electors of each state and the District of Columbia met on December 13, 2004, to cast their votes for president and vice president. The Electoral College itself never meets as one body. Instead the electors from each state and the District of Columbia met in their respective capitols.
The following were the members of the Electoral College from state. All were pledged to and voted for Bush and Cheney.[15]
- Kenneth Culp
- John Zentz
- Michael Miner
- Saundra Huddleston
- Leeann Cook
- Ted Ogle
- Melissa Proffitt Reese
- Dudley Curea
- Larry Shickles
- James Kittle
- Jean Ann Harcourt
See also edit
References edit
- ^ "Archived copy". dcpoliticalreport.com. Archived from the original on November 21, 2010. Retrieved January 13, 2022.
{{cite web}}: CS1 maint: archived copy as title (link) - ^ "2004 Presidential Election Polls. Indiana Polls". US Election Atlas.
- ^ "George W Bush - $374,659,453 raised, '04 election cycle, Republican Party, President".
- ^ "John F Kerry - $345,826,176 raised, '04 election cycle, Democrat Party, President".
- ^ "CNN.com Specials". CNN.
- ^ "CNN.com Specials". CNN.
- ^ "Indiana poll shows tight race with McCain, Obama". Fox News Channel. Associated Press. October 1, 2008. Retrieved August 10, 2009.
- ^ Purnick, Joyce (October 21, 2006). "The 2006 Campaign: Struggle for the House; In a G.O.P. Stronghold, 3 Districts in Indiana Are Now Battlegrounds". The New York Times. Retrieved August 10, 2009.
- ^ "Indiana". Funk & Wagnalls New World Encyclopedia. Funk & Wagnalls.
- ^ a b "Presidential General Election Map Comparison". uselectionatlas.org. Retrieved August 11, 2009.
- ^ Modie, Neil (August 12, 2005). "Where have Seattle's lefties gone?". Seattle Post-Intelligencer. Retrieved August 11, 2009.
- ^ "Indiana General Election November 2, 2004, Statewide". Indiana Secretary of State. November 2, 2004. Retrieved November 7, 2008.
- ^ "Archived copy" (PDF). Archived from the original (PDF) on May 13, 2009. Retrieved July 17, 2009.
{{cite web}}: CS1 maint: archived copy as title (link) - ^ "Presidential Results by Congressional District, 2000-2008 – Swing State Project".
- ^ "The Electoral College". May 20, 2019.