


Summary
The 1988 United States presidential election in Maryland took place on November 8, 1988, as part of the 1988 United States presidential election. Voters chose 10 representatives, or electors to the Electoral College, who voted for president and vice president.
| ||||||||||||||||||||||||||
| ||||||||||||||||||||||||||
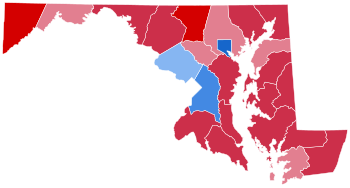 County Results
| ||||||||||||||||||||||||||
| ||||||||||||||||||||||||||

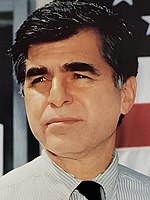
Maryland was won by Vice President George H.W. Bush (R-Texas), with 51.11% of the popular vote, over Massachusetts Governor Mike Dukakis (D-Massachusetts) with 48.20% of the popular vote.[1] Bush ultimately won the national vote, defeating Governor Dukakis.[2]
As of 2020[update], this remains the last time that the Republican presidential candidate has won the state of Maryland, as well as Baltimore County and Howard County.[3] Maryland was one of only two states that Bush carried in 1988 which had voted for Jimmy Carter in 1980, the other being Carter's home state of Georgia.[4] This also marks the only occasion since 1952 in which Maryland has given an outright majority to a non-incumbent Republican.
Maryland weighed in for this election as almost 5% more Democratic than the nation-at-large.
Results edit
| 1988 United States presidential election in Maryland[1] | |||||
|---|---|---|---|---|---|
| Party | Candidate | Votes | Percentage | Electoral votes | |
| Republican | George H. W. Bush | 876,167 | 51.11% | 10 | |
| Democratic | Mike Dukakis | 826,304 | 48.20% | 0 | |
| Libertarian | Ron Paul | 6,748 | 0.39% | 0 | |
| New Alliance | Lenora Fulani | 5,115 | 0.29% | 0 | |
| N/A | Write-ins | 24 | <0.01% | 0 | |
| Totals | 1,714,358 | 100.0% | 10 | ||
Results by county edit
| County | George H.W. Bush Republican |
Michael Dukakis Democratic |
Various candidates Other parties |
Margin | Total votes cast | ||||
|---|---|---|---|---|---|---|---|---|---|
| # | % | # | % | # | % | # | % | ||
| Allegany | 17,462 | 59.19% | 11,844 | 40.15% | 197 | 0.66% | 5,618 | 19.04% | 29,503 |
| Anne Arundel | 98,540 | 63.53% | 55,440 | 35.74% | 1,121 | 0.73% | 43,100 | 27.79% | 155,101 |
| Baltimore | 163,881 | 57.04% | 121,570 | 42.32% | 1,844 | 0.64% | 42,311 | 14.72% | 287,295 |
| Baltimore City | 59,089 | 25.43% | 170,813 | 73.51% | 2,465 | 1.06% | -111,724 | -48.08% | 232,367 |
| Calvert | 10,956 | 62.98% | 6,376 | 36.65% | 65 | 0.37% | 4,580 | 26.33% | 17,397 |
| Caroline | 4,661 | 65.44% | 2,440 | 34.26% | 22 | 0.30% | 2,221 | 31.18% | 7,123 |
| Carroll | 31,224 | 71.37% | 12,368 | 28.27% | 155 | 0.36% | 18,856 | 43.10% | 43,747 |
| Cecil | 13,224 | 62.51% | 7,807 | 36.90% | 124 | 0.59% | 5,417 | 25.61% | 21,155 |
| Charles | 20,828 | 63.57% | 11,823 | 36.09% | 113 | 0.34% | 9,005 | 27.48% | 32,764 |
| Dorchester | 6,343 | 62.55% | 3,709 | 36.58% | 88 | 0.87% | 2,634 | 25.97% | 10,140 |
| Frederick | 32,575 | 65.32% | 17,061 | 34.21% | 231 | 0.47% | 15,514 | 31.11% | 49,867 |
| Garrett | 6,665 | 71.81% | 2,557 | 27.55% | 60 | 0.64% | 4,108 | 44.26% | 9,282 |
| Harford | 38,493 | 65.73% | 19,803 | 33.81% | 270 | 0.46% | 18,690 | 31.92% | 58,566 |
| Howard | 44,153 | 56.22% | 34,007 | 43.30% | 370 | 0.48% | 10,146 | 12.92% | 78,530 |
| Kent | 3,761 | 55.87% | 2,925 | 43.45% | 46 | 0.68% | 836 | 12.42% | 6,732 |
| Montgomery | 154,191 | 48.05% | 165,187 | 51.48% | 1,518 | 0.47% | -10,996 | -3.43% | 320,896 |
| Prince George's | 86,545 | 38.83% | 133,816 | 60.04% | 2,520 | 1.13% | -47,271 | -21.21% | 222,881 |
| Queen Anne's | 7,803 | 66.68% | 3,857 | 32.96% | 43 | 0.36% | 3,946 | 33.72% | 11,703 |
| Somerset | 4,222 | 58.93% | 2,911 | 40.63% | 32 | 0.44% | 1,311 | 18.30% | 7,165 |
| St. Mary's | 12,767 | 62.92% | 7,434 | 36.64% | 89 | 0.44% | 5,333 | 26.28% | 20,290 |
| Talbot | 8,170 | 66.97% | 3,948 | 32.36% | 81 | 0.67% | 4,222 | 34.61% | 12,199 |
| Washington | 25,912 | 63.76% | 14,408 | 35.45% | 318 | 0.79% | 11,504 | 28.31% | 40,638 |
| Wicomico | 16,272 | 63.18% | 9,413 | 36.55% | 70 | 0.27% | 6,859 | 26.63% | 25,755 |
| Worcester | 8,430 | 63.57% | 4,787 | 36.10% | 45 | 0.33% | 3,643 | 27.47% | 13,262 |
| Totals | 876,167 | 51.11% | 826,304 | 48.20% | 11,887 | 0.69% | 49,863 | 2.91% | 1,714,358 |
Counties that flipped from Republican to Democratic edit
By congressional district edit
Bush won 4 of 8 congressional districts, including three held by Democrats. Dukakis won the other 4, including one that elected a Republican.[5]
| District | Dukakis | Bush | Representative |
|---|---|---|---|
| 1st | 36.4% | 63.2% | Roy Dyson |
| 2nd | 37.4% | 62.1% | Helen Delich Bentley |
| 3rd | 54.1% | 45.2% | Ben Cardin |
| 4th | 41.9% | 57.3% | Tom McMillen |
| 5th | 58.9% | 40.0% | Steny Hoyer |
| 6th | 34.1% | 65.4% | Beverly Byron |
| 7th | 81.3% | 17.4% | Kweisi Mfume |
| 8th | 53.4% | 46.1% | Connie Morella |
See also edit
References edit
- ^ a b "1988 Presidential Election". Maryland State Board of Elections. Retrieved May 12, 2019.
- ^ "1988 Presidential General Election Results". U.S. Election Atlas. Retrieved June 8, 2012.
- ^ Sullivan, Robert David; ‘How the Red and Blue Map Evolved Over the Past Century’; America Magazine in The National Catholic Review; June 29, 2016
- ^ "1988 Electoral College Results". National Archives. November 5, 2019. Retrieved January 20, 2022.
- ^ "1988 United States Presidential Election, Results by Congressional District". Western Washington University. Retrieved June 8, 2022.