Summary
The 1976 United States presidential election in California took place on November 2, 1976, as part of the 1976 United States presidential election. State voters chose 45 representatives, or electors, to the Electoral College, who voted for president and vice president.
| ||||||||||||||||||||||||||
| Turnout | 81.53% (of registered voters) 57.32% (of eligible voters) | |||||||||||||||||||||||||
|---|---|---|---|---|---|---|---|---|---|---|---|---|---|---|---|---|---|---|---|---|---|---|---|---|---|---|
| ||||||||||||||||||||||||||
 County Results
| ||||||||||||||||||||||||||
| ||||||||||||||||||||||||||
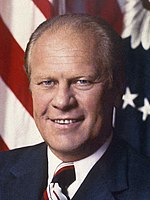
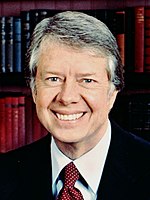
California narrowly voted for the Republican incumbent, Gerald Ford, over the Democratic challenger, Jimmy Carter.
Ford won the state with a plurality of 49.35% of the vote to Carter's 47.57%, a victory margin of 1.78%, which made California almost 4% more Republican than the nation-at-large.
As of the 2020 presidential election, this is the last time that a Democrat has won the counties of Amador, El Dorado, Lassen, Madera, Placer, Shasta, Sierra and Yuba,[2] Carter is also the last candidate from either party to carry Los Angeles by only a plurality. This also remains the last election in which a Republican presidential candidate won at least 40% of the vote in San Francisco, and the last time that county was not the most Democratic in the state. This is also the last time when a Democrat has won the presidency without winning California and the last time that the state would vote Republican in a close election. The state would not vote for a losing candidate again until 2000, and for the loser of the popular vote until 2004.
Results edit
| 1976 United States presidential election in California[3] | |||||
|---|---|---|---|---|---|
| Party | Candidate | Votes | Percentage | Electoral votes | |
| Republican | Gerald Ford (incumbent) | 3,882,244 | 49.35% | 45 | |
| Democratic | Jimmy Carter | 3,742,284 | 47.57% | 0 | |
| No party | Eugene McCarthy (write-in) | 58,412 | 0.74% | 0 | |
| Independent | Roger MacBride | 56,388 | 0.72% | 0 | |
| American Independent | Lester Maddox | 51,098 | 0.65% | 0 | |
| Peace and Freedom | Margaret Wright | 41,731 | 0.53% | 0 | |
| Independent | Peter Camejo | 17,259 | 0.22% | 0 | |
| Independent | Gus Hall | 12,766 | 0.16% | 0 | |
| No party | Thomas J. Anderson (write-in) | 4,565 | 0.06% | 0 | |
| No party | Jules Levin (write-in) | 222 | 0.00% | 0 | |
| No party | Write-ins | 74 | 0.00% | 0 | |
| No party | Ben Bubar (write-in) | 34 | 0.00% | 0 | |
| No party | Ernest Miller (write-in) | 26 | 0.00% | 0 | |
| No party | Frank Taylor (write-in) | 14 | 0.00% | 0 | |
| Invalid or blank votes | — | ||||
| Totals | 7,867,117 | 100.00% | 45 | ||
| Voter turnout | — | ||||
Results by county edit
| County | Gerald Ford Republican |
Jimmy Carter Democratic |
Various candidates Other parties |
Margin | Total votes cast | ||||
|---|---|---|---|---|---|---|---|---|---|
| # | % | # | % | # | % | # | % | ||
| Alameda | 155,280 | 38.09% | 235,988 | 57.89% | 16,413 | 4.02% | -80,708 | -19.80% | 407,681 |
| Alpine | 225 | 50.34% | 189 | 42.28% | 33 | 7.38% | 36 | 8.06% | 447 |
| Amador | 3,699 | 46.13% | 4,037 | 50.35% | 282 | 3.52% | -338 | -4.22% | 8,018 |
| Butte | 28,400 | 51.77% | 24,203 | 44.12% | 2,251 | 4.11% | 4,197 | 7.65% | 54,854 |
| Calaveras | 3,695 | 49.08% | 3,607 | 47.91% | 226 | 3.01% | 88 | 1.17% | 7,528 |
| Colusa | 2,733 | 52.74% | 2,340 | 45.16% | 109 | 2.10% | 393 | 7.58% | 5,182 |
| Contra Costa | 126,598 | 49.35% | 123,742 | 48.24% | 6,194 | 2.41% | 2,856 | 1.11% | 256,534 |
| Del Norte | 2,481 | 45.29% | 2,789 | 50.91% | 208 | 3.80% | -308 | -5.62% | 5,478 |
| El Dorado | 12,472 | 47.69% | 12,763 | 48.80% | 919 | 3.51% | -291 | -1.11% | 26,154 |
| Fresno | 72,533 | 48.10% | 74,958 | 49.71% | 3,314 | 2.19% | -2,425 | -1.61% | 150,805 |
| Glenn | 4,094 | 52.67% | 3,501 | 45.04% | 178 | 2.29% | 593 | 7.63% | 7,773 |
| Humboldt | 18,034 | 41.58% | 23,500 | 54.18% | 1,838 | 4.24% | -5,466 | -12.60% | 43,372 |
| Imperial | 10,618 | 49.94% | 10,244 | 48.18% | 400 | 1.88% | 374 | 1.76% | 21,262 |
| Inyo | 3,905 | 58.23% | 2,635 | 39.29% | 166 | 2.48% | 1,270 | 18.94% | 6,706 |
| Kern | 58,023 | 52.29% | 50,567 | 45.57% | 2,371 | 2.14% | 7,456 | 6.72% | 110,961 |
| Kings | 8,263 | 49.65% | 8,061 | 48.44% | 318 | 1.91% | 202 | 1.21% | 16,642 |
| Lake | 5,462 | 44.46% | 6,374 | 51.88% | 449 | 3.64% | -912 | -7.42% | 12,285 |
| Lassen | 3,007 | 42.97% | 3,801 | 54.32% | 190 | 2.71% | -794 | -11.35% | 6,998 |
| Los Angeles | 1,174,926 | 47.78% | 1,221,893 | 49.69% | 62,258 | 2.53% | -46,967 | -1.91% | 2,459,077 |
| Madera | 6,844 | 45.96% | 7,625 | 51.20% | 423 | 2.84% | -781 | -5.24% | 14,892 |
| Marin | 53,425 | 52.52% | 43,590 | 42.86% | 4,700 | 4.62% | 9,835 | 9.66% | 101,715 |
| Mariposa | 2,012 | 46.61% | 2,093 | 48.48% | 212 | 4.91% | -81 | -1.87% | 4,317 |
| Mendocino | 9,784 | 45.49% | 10,653 | 49.53% | 1,072 | 4.98% | -869 | -4.04% | 21,509 |
| Merced | 14,842 | 46.08% | 16,637 | 51.65% | 729 | 2.27% | -1,795 | -5.57% | 32,208 |
| Modoc | 1,917 | 51.20% | 1,733 | 46.29% | 94 | 2.51% | 184 | 4.91% | 3,744 |
| Mono | 1,600 | 58.80% | 1,025 | 37.67% | 96 | 3.53% | 575 | 21.13% | 2,721 |
| Monterey | 40,896 | 51.02% | 36,849 | 45.97% | 2,408 | 3.01% | 4,047 | 5.05% | 80,153 |
| Napa | 20,839 | 51.83% | 18,048 | 44.89% | 1,318 | 3.28% | 2,791 | 6.94% | 40,205 |
| Nevada | 8,170 | 48.40% | 7,926 | 46.95% | 785 | 4.65% | 244 | 1.45% | 16,881 |
| Orange | 408,632 | 62.16% | 232,246 | 35.33% | 16,555 | 2.51% | 176,386 | 26.83% | 657,433 |
| Placer | 18,154 | 45.03% | 21,026 | 52.16% | 1,131 | 2.81% | -2,872 | -7.13% | 40,311 |
| Plumas | 2,884 | 43.94% | 3,429 | 52.25% | 250 | 3.81% | -545 | -8.31% | 6,563 |
| Riverside | 97,774 | 49.24% | 96,228 | 48.46% | 4,556 | 2.30% | 1,546 | 0.78% | 198,558 |
| Sacramento | 123,110 | 44.63% | 144,203 | 52.27% | 8,563 | 3.10% | -21,093 | -7.64% | 275,876 |
| San Benito | 97,774 | 49.24% | 96,228 | 48.46% | 4,556 | 2.30% | 1,546 | 0.78% | 6,680 |
| San Bernardino | 113,265 | 49.49% | 109,636 | 47.90% | 5,984 | 2.61% | 3,629 | 1.59% | 228,885 |
| San Diego | 353,302 | 55.74% | 263,654 | 41.60% | 16,839 | 2.66% | 89,648 | 14.14% | 633,795 |
| San Francisco | 103,561 | 40.31% | 133,733 | 52.06% | 19,594 | 7.63% | -30,172 | -11.75% | 256,888 |
| San Joaquin | 50,277 | 49.60% | 48,733 | 48.08% | 2,351 | 2.32% | 1,544 | 1.52% | 101,361 |
| San Luis Obispo | 27,785 | 51.17% | 24,926 | 45.91% | 1,587 | 2.92% | 2,859 | 5.26% | 54,298 |
| San Mateo | 117,338 | 50.63% | 102,896 | 44.40% | 11,507 | 4.97% | 14,442 | 6.23% | 231,741 |
| Santa Barbara | 60,922 | 50.83% | 55,018 | 45.91% | 3,904 | 3.26% | 5,904 | 4.92% | 119,844 |
| Santa Clara | 219,188 | 49.46% | 208,023 | 46.94% | 15,927 | 3.60% | 11,165 | 2.52% | 443,138 |
| Santa Cruz | 31,872 | 43.09% | 37,772 | 51.06% | 4,325 | 5.85% | -5,900 | -7.97% | 73,969 |
| Shasta | 17,273 | 45.63% | 19,200 | 50.72% | 1,381 | 3.65% | -1,927 | -5.09% | 37,854 |
| Sierra | 680 | 43.15% | 841 | 53.36% | 55 | 3.49% | -161 | -10.21% | 1,576 |
| Siskiyou | 7,070 | 48.37% | 7,060 | 48.31% | 485 | 3.32% | 10 | 0.06% | 14,615 |
| Solano | 26,136 | 42.40% | 33,682 | 54.64% | 1,826 | 2.96% | -7,546 | -12.24% | 61,644 |
| Sonoma | 50,555 | 47.72% | 50,353 | 47.52% | 5,044 | 4.76% | 202 | 0.20% | 105,952 |
| Stanislaus | 32,937 | 44.83% | 38,448 | 52.34% | 2,080 | 2.83% | -5,511 | -7.51% | 73,465 |
| Sutter | 8,745 | 54.21% | 6,966 | 43.18% | 420 | 2.61% | 1,779 | 11.03% | 16,131 |
| Tehama | 6,110 | 44.81% | 6,990 | 51.27% | 535 | 3.92% | -880 | -6.46% | 13,635 |
| Trinity | 1,989 | 45.66% | 2,172 | 49.86% | 195 | 4.48% | -183 | -4.20% | 4,356 |
| Tulare | 31,864 | 54.52% | 25,551 | 43.72% | 1,027 | 1.76% | 6,313 | 10.80% | 58,442 |
| Tuolumne | 6,104 | 46.94% | 6,492 | 49.93% | 407 | 3.13% | -388 | -2.99% | 13,003 |
| Ventura | 82,670 | 53.20% | 68,529 | 44.10% | 4,201 | 2.70% | 14,141 | 9.10% | 155,400 |
| Yolo | 18,376 | 42.42% | 23,533 | 54.33% | 1,408 | 3.25% | -5,157 | -11.91% | 43,317 |
| Yuba | 5,496 | 44.74% | 6,451 | 52.51% | 338 | 2.75% | -955 | -7.77% | 12,285 |
| Total | 3,882,244 | 49.35% | 3,742,284 | 47.57% | 242,589 | 3.08% | 139,960 | 1.78% | 7,867,117 |
Counties that flipped from Republican to Democratic edit
References edit
- ^ "Historical Voter Registration and Participation in Statewide General Elections 1910-2018" (PDF). California Secretary of State. Retrieved May 5, 2022.
- ^ Sullivan, Robert David; ‘How the Red and Blue Map Evolved Over the Past Century’; America Magazine in The National Catholic Review; June 29, 2016
- ^ "1976 Presidential General Election Results - California". Dave Leip's U.S. Election Atlas. Retrieved August 25, 2008.


