


Summary
The 1948 United States presidential election in Arkansas took place on November 2, 1948, as part of the 1948 United States presidential election. State voters chose nine[2] representatives, or electors, to the Electoral College, who voted for president and vice president. This would be the last presidential election where Arkansas had nine electoral votes: the Great Migration would see the state lose three congressional districts in the next decade-and-a-half.
| |||||||||||||||||||||||||||||||||
All 9 Arkansas votes to the Electoral College | |||||||||||||||||||||||||||||||||
|---|---|---|---|---|---|---|---|---|---|---|---|---|---|---|---|---|---|---|---|---|---|---|---|---|---|---|---|---|---|---|---|---|---|
| |||||||||||||||||||||||||||||||||
 County Results
| |||||||||||||||||||||||||||||||||
| |||||||||||||||||||||||||||||||||

Except for the Unionist Ozark counties of Newton and Searcy where Republicans controlled local government, Arkansas since the end of Reconstruction had been a classic one-party Democratic "Solid South" state.[3] Disfranchisement of effectively all black people and most poor whites had meant that outside those two aberrant counties, the Republican Party was completely moribund and Democratic primaries the only competitive elections.
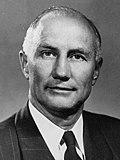
However, ever since seeing the potential effect on the United States' image abroad (and ability to win the Cold War against the radically egalitarian rhetoric of Communism)[4] of the beating and blinding of Isaac Woodard three hours after being discharged from the army, President Truman was attempting to launch a Civil Rights bill, involving desegregation of the military. This produced severe opposition from Southern Democrats, who aimed to have South Carolina Governor James Strom Thurmond listed as Democratic Presidential nominee and Mississippi Governor Fielding Wright as Vice-Presidential nominee.
Unlike Oklahoma, Tennessee, North Carolina or Virginia, Arkansas did not have a major threat from the Republican Party to block local Democratic support for Thurmond,[5] but it had only half the proportion of blacks found in Mississippi or South Carolina.[6] At the time when it became clear that a Southern fracture from the national Democratic Party was on the agenda, Arkansas was deeply divided between a Dixiecrat faction headed by outgoing Governor Ben T. Laney and a loyalist faction led by Sidney S. McMath.[7]
McMath was to win the Democratic gubernatorial primary that was in this one-party state tantamount to election, and despite the efforts of Laney and state party chairman Arthur Adams, it was clear from the beginning of the campaign that they held little sway over the Democratic rank and file who were loyal to Truman.[8] In May 1948 Governor Laney became chairman of the "States' Rights Democrats";[9] however on July 12 the possibility of Laney himself becoming the nominee ended when he refused to support anyone.[10] However, as late as the September 22 Democratic Convention the Dixiecrats had hopes of pledging Arkansas' Democratic presidential electors to Thurmond and Wright; however McMath and Congressman Charles Fuller were able to persuade the electors to remain loyal to President Truman.[11]
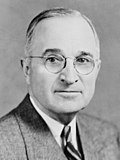
With the state's Democratic electors pledged to Truman, the incumbent President and running mate Kentucky Senator Alben W. Barkley easily carried Arkansas with 61.72 percent of the popular vote, against New York Governor Thomas Dewey and California Governor Earl Warren's 21.02 percent of the popular vote.[12][13] Vis-à-vis the 1944 election, Truman picked up Benton County and Searcy County, the latter of which had previously only voted Democratic once since the Civil War.[a]
Thurmond, running as a third-party candidate, was able to capture 16.52 percent of Arkansas' vote. The Dixiecrats ran strongest in the Delta region of the state where Truman's Civil Rights and "Fair Deal" policies were most feared by the powerful Black Belt planters;[14] Thurmond carried three counties with entirely nonvoting black majorities and was second in twenty-eight others. However, in the hilly northwestern half of the state, Thurmond failed to crack 5 percent of the vote in eighteen counties. As of the 2020 presidential election[update], this is the last election in which Benton County and Sebastian County voted for a Democratic presidential candidate.[15] Arkansas was also the only state in the entire country where Norman Thomas beat Henry Wallace.
Campaign edit
The Republican Party of Arkansas voted to send an uncommitted fourteen member delegation to the Republican National Convention.[16]
17% of white voters supported Thurmond.[17]
Results edit
| Party | Candidate | Votes | % | |
|---|---|---|---|---|
| Democratic | Harry S. Truman (inc.) | 149,659 | 61.72% | |
| Republican | Thomas Dewey | 50,959 | 21.02% | |
| Dixiecrat | Strom Thurmond | 40,068 | 16.52% | |
| Socialist | Norman Thomas | 1,037 | 0.43% | |
| Progressive | Henry A. Wallace | 751 | 0.31% | |
| Prohibition | Claude A. Watson | 1 | 0.00% | |
| Total votes | 242,475 | 100% | ||
Results by county edit
| County | Harry S. Truman Democratic |
Thomas Edmund Dewey Republican |
James Strom Thurmond States' Rights Democratic |
Norman Mattoon Thomas Socialist |
Henry Agard Wallace Progressive |
Margin | Total votes cast | ||||||
|---|---|---|---|---|---|---|---|---|---|---|---|---|---|
| # | % | # | % | # | % | # | % | # | % | # | % | ||
| Arkansas | 1,781 | 53.07% | 737 | 21.96% | 806 | 24.02% | 23 | 0.69% | 9 | 0.27% | 975[b] | 29.05% | 3,356 |
| Ashley | 1,844 | 76.58% | 197 | 8.18% | 342 | 14.20% | 24 | 1.00% | 1 | 0.04% | 1,502[b] | 62.38% | 2,408 |
| Baxter | 1,098 | 62.39% | 553 | 31.42% | 54 | 3.07% | 45 | 2.56% | 10 | 0.57% | 545 | 30.97% | 1,760 |
| Benton | 3,281 | 50.38% | 2,911 | 44.70% | 274 | 4.21% | 13 | 0.20% | 34 | 0.52% | 370 | 5.68% | 6,513 |
| Boone | 3,190 | 63.86% | 1,499 | 30.01% | 274 | 5.49% | 11 | 0.22% | 21 | 0.42% | 1,691 | 33.85% | 4,995 |
| Bradley | 1,426 | 65.20% | 213 | 9.74% | 532 | 24.33% | 7 | 0.32% | 9 | 0.41% | 894[b] | 40.88% | 2,187 |
| Calhoun | 768 | 83.66% | 45 | 4.90% | 104 | 11.33% | 0 | 0.00% | 1 | 0.11% | 664[b] | 72.33% | 918 |
| Carroll | 2,032 | 55.10% | 1,525 | 41.35% | 98 | 2.66% | 15 | 0.41% | 18 | 0.49% | 507 | 13.75% | 3,688 |
| Chicot | 952 | 54.03% | 203 | 11.52% | 598 | 33.94% | 4 | 0.23% | 5 | 0.28% | 354[b] | 20.09% | 1,762 |
| Clark | 1,750 | 69.75% | 383 | 15.27% | 363 | 14.47% | 9 | 0.36% | 4 | 0.16% | 1,367 | 54.48% | 2,509 |
| Clay | 2,069 | 66.94% | 878 | 28.41% | 128 | 4.14% | 14 | 0.45% | 2 | 0.06% | 1,191 | 38.53% | 3,091 |
| Cleburne | 1,061 | 73.32% | 312 | 21.56% | 64 | 4.42% | 8 | 0.55% | 2 | 0.14% | 749 | 51.76% | 1,447 |
| Cleveland | 679 | 67.50% | 79 | 7.85% | 245 | 24.35% | 3 | 0.30% | 0 | 0.00% | 434[b] | 43.14% | 1,006 |
| Columbia | 1,788 | 59.98% | 217 | 7.28% | 962 | 32.27% | 12 | 0.40% | 2 | 0.07% | 826[b] | 27.71% | 2,981 |
| Conway | 1,771 | 72.17% | 425 | 17.32% | 248 | 10.11% | 5 | 0.20% | 5 | 0.20% | 1,346 | 54.85% | 2,454 |
| Craighead | 3,238 | 63.37% | 759 | 14.85% | 1,054 | 20.63% | 42 | 0.82% | 17 | 0.33% | 2,184[b] | 42.74% | 5,110 |
| Crawford | 1,730 | 58.60% | 1,002 | 33.94% | 190 | 6.44% | 18 | 0.61% | 12 | 0.41% | 728 | 24.66% | 2,952 |
| Crittenden | 594 | 24.83% | 137 | 5.73% | 1,657 | 69.27% | 2 | 0.08% | 2 | 0.08% | -1,063[b] | -44.44% | 2,392 |
| Cross | 1,100 | 48.57% | 213 | 9.40% | 949 | 41.90% | 2 | 0.09% | 1 | 0.04% | 151[b] | 6.67% | 2,265 |
| Dallas | 1,174 | 68.98% | 152 | 8.93% | 370 | 21.74% | 4 | 0.24% | 2 | 0.12% | 804[b] | 47.24% | 1,702 |
| Desha | 2,122 | 69.96% | 233 | 7.68% | 670 | 22.09% | 4 | 0.13% | 4 | 0.13% | 1,452[b] | 47.87% | 3,033 |
| Drew | 1,204 | 59.40% | 182 | 8.98% | 630 | 31.08% | 5 | 0.25% | 6 | 0.30% | 574[b] | 28.32% | 2,027 |
| Faulkner | 2,653 | 73.76% | 626 | 17.40% | 304 | 8.45% | 10 | 0.28% | 4 | 0.11% | 2,027 | 56.35% | 3,597 |
| Franklin | 1,591 | 76.05% | 391 | 18.69% | 95 | 4.54% | 6 | 0.29% | 9 | 0.43% | 1,200 | 57.36% | 2,092 |
| Fulton | 850 | 69.27% | 339 | 27.63% | 32 | 2.61% | 2 | 0.16% | 4 | 0.33% | 511 | 41.65% | 1,227 |
| Garland | 3,764 | 52.61% | 2,286 | 31.95% | 994 | 13.89% | 48 | 0.67% | 62 | 0.87% | 1,478 | 20.66% | 7,154 |
| Grant | 883 | 71.50% | 121 | 9.80% | 207 | 16.76% | 19 | 1.54% | 5 | 0.40% | 676[b] | 54.74% | 1,235 |
| Greene | 2,657 | 78.38% | 502 | 14.81% | 188 | 5.55% | 25 | 0.74% | 18 | 0.53% | 2,155 | 63.57% | 3,390 |
| Hempstead | 1,683 | 54.84% | 386 | 12.58% | 990 | 32.26% | 6 | 0.20% | 4 | 0.13% | 693[b] | 22.58% | 3,069 |
| Hot Spring | 1,932 | 69.90% | 555 | 20.08% | 261 | 9.44% | 12 | 0.43% | 4 | 0.14% | 1,377 | 49.82% | 2,764 |
| Howard | 1,250 | 75.67% | 199 | 12.05% | 190 | 11.50% | 13 | 0.79% | 0 | 0.00% | 1,051 | 63.62% | 1,652 |
| Independence | 2,340 | 66.08% | 855 | 24.15% | 330 | 9.32% | 4 | 0.11% | 12 | 0.34% | 1,485 | 41.94% | 3,541 |
| Izard | 1,283 | 81.93% | 240 | 15.33% | 36 | 2.30% | 4 | 0.26% | 3 | 0.19% | 1,043 | 66.60% | 1,566 |
| Jackson | 2,696 | 82.45% | 338 | 10.34% | 226 | 6.91% | 8 | 0.24% | 2 | 0.06% | 2,358 | 72.11% | 3,270 |
| Jefferson | 5,086 | 61.92% | 1,176 | 14.32% | 1,879 | 22.88% | 49 | 0.60% | 24 | 0.29% | 3,207[b] | 39.04% | 8,214 |
| Johnson | 1,565 | 69.59% | 523 | 23.25% | 138 | 6.14% | 11 | 0.49% | 12 | 0.53% | 1,042 | 46.33% | 2,249 |
| Lafayette | 700 | 49.16% | 113 | 7.94% | 578 | 40.59% | 31 | 2.18% | 2 | 0.14% | 122[b] | 8.57% | 1,424 |
| Lawrence | 2,001 | 74.89% | 497 | 18.60% | 151 | 5.65% | 11 | 0.41% | 12 | 0.45% | 1,504 | 56.29% | 2,672 |
| Lee | 528 | 35.41% | 95 | 6.37% | 866 | 58.08% | 1 | 0.07% | 1 | 0.07% | -338[b] | -22.67% | 1,491 |
| Lincoln | 1,108 | 65.91% | 378 | 22.49% | 188 | 11.18% | 5 | 0.30% | 2 | 0.12% | 730 | 43.43% | 1,681 |
| Little River | 900 | 59.06% | 169 | 11.09% | 447 | 29.33% | 4 | 0.26% | 4 | 0.26% | 453[b] | 29.72% | 1,524 |
| Logan | 2,130 | 66.73% | 902 | 28.26% | 143 | 4.48% | 9 | 0.28% | 8 | 0.25% | 1,228 | 38.47% | 3,192 |
| Lonoke | 2,065 | 69.04% | 383 | 12.81% | 535 | 17.89% | 3 | 0.10% | 5 | 0.17% | 1,530[b] | 51.15% | 2,991 |
| Madison | 2,041 | 47.50% | 2,201 | 51.22% | 39 | 0.91% | 10 | 0.23% | 6 | 0.14% | -160 | -3.72% | 4,297 |
| Marion | 1,133 | 72.58% | 381 | 24.41% | 31 | 1.99% | 8 | 0.51% | 8 | 0.51% | 752 | 48.17% | 1,561 |
| Miller | 2,850 | 62.24% | 488 | 10.66% | 1,223 | 26.71% | 9 | 0.20% | 9 | 0.20% | 1,627[b] | 35.53% | 4,579 |
| Mississippi | 3,763 | 59.40% | 771 | 12.17% | 1,769 | 27.92% | 27 | 0.43% | 5 | 0.08% | 1,994[b] | 31.48% | 6,335 |
| Monroe | 1,431 | 60.89% | 299 | 12.72% | 614 | 26.13% | 1 | 0.04% | 5 | 0.21% | 817[b] | 34.77% | 2,350 |
| Montgomery | 935 | 75.22% | 236 | 18.99% | 60 | 4.83% | 5 | 0.40% | 7 | 0.56% | 699 | 56.23% | 1,243 |
| Nevada | 1,140 | 64.33% | 202 | 11.40% | 418 | 23.59% | 10 | 0.56% | 2 | 0.11% | 722[b] | 40.74% | 1,772 |
| Newton | 848 | 48.51% | 879 | 50.29% | 13 | 0.74% | 4 | 0.23% | 4 | 0.23% | -31 | -1.77% | 1,748 |
| Ouachita | 3,315 | 68.80% | 476 | 9.88% | 1,023 | 21.23% | 0 | 0.00% | 4 | 0.08% | 2,292[b] | 47.57% | 4,818 |
| Perry | 731 | 67.00% | 201 | 18.42% | 156 | 14.30% | 0 | 0.00% | 3 | 0.27% | 530 | 48.58% | 1,091 |
| Phillips | 1,018 | 32.85% | 351 | 11.33% | 1,722 | 55.57% | 4 | 0.13% | 4 | 0.13% | -704[b] | -22.72% | 3,099 |
| Pike | 997 | 73.80% | 256 | 18.95% | 89 | 6.59% | 8 | 0.59% | 1 | 0.07% | 741 | 54.85% | 1,351 |
| Poinsett | 2,415 | 65.24% | 435 | 11.75% | 830 | 22.42% | 13 | 0.35% | 9 | 0.24% | 1,585[b] | 42.81% | 3,702 |
| Polk | 1,417 | 66.21% | 554 | 25.89% | 127 | 5.93% | 28 | 1.31% | 14 | 0.65% | 863 | 40.33% | 2,140 |
| Pope | 2,525 | 67.95% | 764 | 20.56% | 417 | 11.22% | 5 | 0.13% | 5 | 0.13% | 1,761 | 47.39% | 3,716 |
| Prairie | 1,020 | 60.79% | 260 | 15.49% | 379 | 22.59% | 18 | 1.07% | 1 | 0.06% | 641[b] | 38.20% | 1,678 |
| Pulaski | 13,120 | 53.25% | 5,910 | 23.99% | 5,443 | 22.09% | 51 | 0.21% | 115 | 0.47% | 7,210 | 29.26% | 24,639 |
| Randolph | 2,139 | 81.24% | 377 | 14.32% | 109 | 4.14% | 4 | 0.15% | 4 | 0.15% | 1,762 | 66.92% | 2,633 |
| St. Francis | 1,011 | 46.91% | 178 | 8.26% | 957 | 44.41% | 4 | 0.19% | 5 | 0.23% | 54[b] | 2.51% | 2,155 |
| Saline | 2,070 | 72.18% | 390 | 13.60% | 341 | 11.89% | 49 | 1.71% | 18 | 0.63% | 1,680 | 58.58% | 2,868 |
| Scott | 1,093 | 77.63% | 260 | 18.47% | 37 | 2.63% | 14 | 0.99% | 4 | 0.28% | 833 | 59.16% | 1,408 |
| Searcy | 1,205 | 51.81% | 1,064 | 45.74% | 44 | 1.89% | 9 | 0.39% | 4 | 0.17% | 141 | 6.06% | 2,326 |
| Sebastian | 5,075 | 57.36% | 2,928 | 33.09% | 777 | 8.78% | 41 | 0.46% | 27 | 0.31% | 2,147 | 24.27% | 8,848 |
| Sevier | 1,314 | 71.53% | 267 | 14.53% | 231 | 12.57% | 21 | 1.14% | 4 | 0.22% | 1,047 | 57.00% | 1,837 |
| Sharp | 1,078 | 74.19% | 295 | 20.30% | 71 | 4.89% | 4 | 0.28% | 5 | 0.34% | 783 | 53.89% | 1,453 |
| Stone | 1,186 | 61.80% | 644 | 33.56% | 76 | 3.96% | 4 | 0.21% | 9 | 0.47% | 542 | 28.24% | 1,919 |
| Union | 5,588 | 67.01% | 1,039 | 12.46% | 1,691 | 20.28% | 11 | 0.13% | 10 | 0.12% | 3,897[b] | 46.73% | 8,339 |
| Van Buren | 1,324 | 63.96% | 617 | 29.81% | 119 | 5.75% | 4 | 0.19% | 6 | 0.29% | 707 | 34.15% | 2,070 |
| Washington | 3,493 | 49.38% | 2,859 | 40.42% | 581 | 8.21% | 85 | 1.20% | 56 | 0.79% | 634 | 8.96% | 7,074 |
| White | 3,193 | 69.04% | 833 | 18.01% | 563 | 12.17% | 20 | 0.43% | 16 | 0.35% | 2,360 | 51.03% | 4,625 |
| Woodruff | 1,008 | 55.11% | 207 | 11.32% | 593 | 32.42% | 16 | 0.87% | 5 | 0.27% | 415[b] | 22.69% | 1,829 |
| Yell | 1,866 | 77.08% | 408 | 16.85% | 135 | 5.58% | 0 | 0.00% | 12 | 0.50% | 1,458 | 60.22% | 2,421 |
| Totals | 149,659 | 61.72% | 50,959 | 21.02% | 40,068 | 16.52% | 1,038 | 0.43% | 751 | 0.31% | 98,700 | 40.71% | 242,475 |
See also edit
Notes edit
- ^ The only other Democrats to claim Searcy County since the Civil War have been Franklin D. Roosevelt in 1932 and Jimmy Carter in 1976, although some figures for 1912 have Woodrow Wilson carrying the county because the totals for incumbent William Howard Taft in Searcy and Sebastian counties are contradictory.
- ^ a b c d e f g h i j k l m n o p q r s t u v w x y z aa ab ac ad ae In this county where Dewey ran third behind both Truman and Thurmond, margin given is Truman vote minus Thurmond vote and percentage margin Truman percentage minus Thurmond percentage.
References edit
- ^ "United States Presidential election of 1948 — Encyclopædia Britannica". Retrieved October 25, 2017.
- ^ "1948 Election for the Forty-First Term (1949-53)". Retrieved October 25, 2017.
- ^ See Urwin, Cathy Kunzinger. Agenda for Reform: Winthrop Rockefeller as Governor of Arkansas, 1967-71. p. 32. ISBN 1557282005.
- ^ Geselbracht, Raymond H. (ed.). The Civil Rights Legacy of Harry S. Truman. p. 53. ISBN 1931112673.
- ^ Key, Valdimer Orlando (1949). Southern Politics in State and Nation. Alfred A. Knopf. p. 336.
- ^ Key. Southern Politics, p. 254
- ^ Williams, Nancy A.; Whayne, Jeannie M. Arkansas Biography: A Collection of Notable Lives. p. 166. ISBN 1557285888.
- ^ Frederickson, Kari. The Dixiecrat Revolt and the End of the Solid South, 1932-1968. p. 117. ISBN 0807849103.
- ^ Donovan, Timothy Paul; Gatewood, Willard B.; Whayne, Jeannie M. The Governors of Arkansas: Essays in Political Biography. p. 208. ISBN 9781557280411.
- ^ McMath, Sid. Promises Kept: a Memoir. pp. 198–199. ISBN 1610753291.
- ^ McMath. Promises Kept, p. 203
- ^ "1948 Presidential General Election Results — Arkansas". Retrieved October 25, 2017.
- ^ "The American Presidency Project — Election of 1948". Retrieved October 25, 2017.
- ^ Key. Southern Politics, p. 343
- ^ Sullivan, Robert David (June 29, 2016). "How the Red and Blue Map Evolved Over the Past Century". The National Catholic Review (America Magazine ed.).
- ^ "Uncommitted Delegation". Casper Star-Tribune. May 12, 1948. p. 2. Archived from the original on January 19, 2024 – via Newspapers.com.
- ^ Black & Black 1992, p. 147.
- ^ "1948 Presidential Election Popular Vote". Géoelections. (.xlsx file for €15)
- ^ "Popular Vote for Strom Thurmond". Géoelections. (.xlsx file for €15)
- ^ "Popular Vote for Henry Wallace". Géoelections. (.xlsx file for €15)
Works cited edit
- Black, Earl; Black, Merle (1992). The Vital South: How Presidents Are Elected. Harvard University Press. ISBN 0674941306.