


Summary
The 1940 United States presidential election in North Dakota took place on November 5, 1940, as part of the 1940 United States presidential election. Voters chose four[2] representatives, or electors, to the Electoral College, who voted for president and vice president.
| ||||||||||||||||||||||||||
All 4 North Dakota votes to the Electoral College | ||||||||||||||||||||||||||
|---|---|---|---|---|---|---|---|---|---|---|---|---|---|---|---|---|---|---|---|---|---|---|---|---|---|---|
| ||||||||||||||||||||||||||
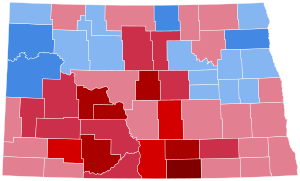 County Results
| ||||||||||||||||||||||||||
| ||||||||||||||||||||||||||

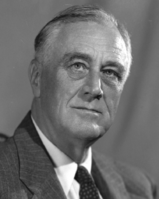
North Dakota was won by Wendell Willkie (R–New York), running with Minority Leader Charles L. McNary, with 55.06% of the popular vote, against incumbent President Franklin D. Roosevelt (D–New York), running with Secretary Henry A. Wallace, with 44.18% of the popular vote.[3][4]
With 55.06% of the popular vote, North Dakota would prove to be Willkie's fourth strongest state in the 1940 election in terms of popular vote percentage, after fellow free-soil Plains West states South Dakota, Nebraska and Kansas.[5]
This was the first election since North Dakota's inaugural 1892 election in which it voted for a losing candidate. Then, it narrowly voted for Populist candidate James B. Weaver. However, due to a fusion between Weaver and the winning Democrat Grover Cleveland, North Dakota cast a single elector for Cleveland as well. That makes this the first election in which North Dakota did not cast a single electoral vote for the winning candidate, or in which the state backed a losing Republican candidate.
Results edit
| Party | Candidate | Votes | % | |
|---|---|---|---|---|
| Republican | Wendell Willkie | 154,590 | 55.06% | |
| Democratic | Franklin D. Roosevelt (inc.) | 124,036 | 44.18% | |
| Socialist | Norman Thomas | 1,279 | 0.46% | |
| Not Designated | Alfred Knutson | 545 | 0.19% | |
| Prohibition | Roger Babson | 325 | 0.12% | |
| Total votes | 280,775 | 100% | ||
Results by county edit
| County[6] | Wendell Lewis Willkie Republican |
Franklin Delano Roosevelt Democratic |
Norman Mattoon Thomas Socialist |
Alfred B. Knutson Not Designated |
Roger Ward Babson Prohibition |
Margin | Total votes cast | ||||||
|---|---|---|---|---|---|---|---|---|---|---|---|---|---|
| # | % | # | % | # | % | # | % | # | % | # | % | ||
| Adams | 1,231 | 58.76% | 837 | 39.95% | 19 | 0.91% | 4 | 0.19% | 4 | 0.19% | 394 | 18.81% | 2,095 |
| Barnes | 4,649 | 57.67% | 3,384 | 41.97% | 21 | 0.26% | 3 | 0.04% | 5 | 0.06% | 1,265 | 15.69% | 8,062 |
| Benson | 2,485 | 45.85% | 2,898 | 53.47% | 30 | 0.55% | 2 | 0.04% | 5 | 0.09% | -413 | -7.62% | 5,420 |
| Billings | 663 | 62.08% | 404 | 37.83% | 1 | 0.09% | 0 | 0.00% | 0 | 0.00% | 259 | 24.25% | 1,068 |
| Bottineau | 3,129 | 55.60% | 2,469 | 43.87% | 29 | 0.52% | 1 | 0.02% | 0 | 0.00% | 660 | 11.73% | 5,628 |
| Bowman | 927 | 50.63% | 882 | 48.17% | 20 | 1.09% | 2 | 0.11% | 0 | 0.00% | 45 | 2.46% | 1,831 |
| Burke | 1,951 | 57.53% | 1,342 | 39.58% | 80 | 2.36% | 7 | 0.21% | 11 | 0.32% | 609 | 17.96% | 3,391 |
| Burleigh | 5,858 | 57.06% | 4,350 | 42.37% | 29 | 0.28% | 22 | 0.21% | 7 | 0.07% | 1,508 | 14.69% | 10,266 |
| Cass | 12,567 | 51.11% | 11,911 | 48.45% | 74 | 0.30% | 17 | 0.07% | 17 | 0.07% | 656 | 2.67% | 24,586 |
| Cavalier | 2,845 | 50.64% | 2,757 | 49.07% | 10 | 0.18% | 2 | 0.04% | 4 | 0.07% | 88 | 1.57% | 5,618 |
| Dickey | 2,777 | 57.44% | 1,721 | 35.59% | 13 | 0.27% | 314 | 6.49% | 10 | 0.21% | 1,056 | 21.84% | 4,835 |
| Divide | 1,437 | 44.32% | 1,771 | 54.63% | 29 | 0.89% | 1 | 0.03% | 4 | 0.12% | -334 | -10.30% | 3,242 |
| Dunn | 2,132 | 60.29% | 1,392 | 39.37% | 6 | 0.17% | 1 | 0.03% | 5 | 0.14% | 740 | 20.93% | 3,536 |
| Eddy | 1,319 | 48.42% | 1,368 | 50.22% | 37 | 1.36% | 0 | 0.00% | 0 | 0.00% | -49 | -1.80% | 2,724 |
| Emmons | 3,515 | 77.29% | 1,004 | 22.08% | 21 | 0.46% | 1 | 0.02% | 7 | 0.15% | 2,511 | 55.21% | 4,548 |
| Foster | 1,109 | 43.20% | 1,446 | 56.33% | 8 | 0.31% | 4 | 0.16% | 0 | 0.00% | -337 | -13.13% | 2,567 |
| Golden Valley | 873 | 55.57% | 689 | 43.86% | 3 | 0.19% | 6 | 0.38% | 0 | 0.00% | 184 | 11.71% | 1,571 |
| Grand Forks | 7,043 | 45.42% | 8,396 | 54.15% | 46 | 0.30% | 12 | 0.08% | 9 | 0.06% | -1,353 | -8.73% | 15,506 |
| Grant | 2,815 | 81.52% | 627 | 18.16% | 11 | 0.32% | 0 | 0.00% | 0 | 0.00% | 2,188 | 63.37% | 3,453 |
| Griggs | 1,117 | 43.09% | 1,464 | 56.48% | 8 | 0.31% | 3 | 0.12% | 0 | 0.00% | -347 | -13.39% | 2,592 |
| Hettinger | 2,468 | 78.32% | 671 | 21.29% | 8 | 0.25% | 4 | 0.13% | 0 | 0.00% | 1,797 | 57.03% | 3,151 |
| Kidder | 2,214 | 72.31% | 837 | 27.34% | 2 | 0.07% | 1 | 0.03% | 8 | 0.26% | 1,377 | 44.97% | 3,062 |
| LaMoure | 2,943 | 63.70% | 1,637 | 35.43% | 26 | 0.56% | 6 | 0.13% | 8 | 0.17% | 1,306 | 28.27% | 4,620 |
| Logan | 2,572 | 83.59% | 498 | 16.18% | 5 | 0.16% | 2 | 0.06% | 0 | 0.00% | 2,074 | 67.40% | 3,077 |
| McHenry | 3,894 | 63.07% | 2,225 | 36.04% | 28 | 0.45% | 21 | 0.34% | 6 | 0.10% | 1,669 | 27.03% | 6,174 |
| McIntosh | 3,494 | 91.66% | 318 | 8.34% | 0 | 0.00% | 0 | 0.00% | 0 | 0.00% | 3,176 | 83.32% | 3,812 |
| McKenzie | 1,563 | 38.63% | 2,440 | 60.31% | 21 | 0.52% | 8 | 0.20% | 14 | 0.35% | -877 | -21.68% | 4,046 |
| McLean | 4,113 | 58.99% | 2,666 | 38.24% | 167 | 2.40% | 13 | 0.19% | 13 | 0.19% | 1,447 | 20.75% | 6,972 |
| Mercer | 3,341 | 85.36% | 567 | 14.49% | 5 | 0.13% | 1 | 0.03% | 0 | 0.00% | 2,774 | 70.87% | 3,914 |
| Morton | 5,499 | 65.25% | 2,889 | 34.28% | 22 | 0.26% | 6 | 0.07% | 12 | 0.14% | 2,610 | 30.97% | 8,428 |
| Mountrail | 1,981 | 44.67% | 2,392 | 53.93% | 39 | 0.88% | 12 | 0.27% | 11 | 0.25% | -411 | -9.27% | 4,435 |
| Nelson | 1,859 | 43.07% | 2,435 | 56.42% | 11 | 0.25% | 6 | 0.14% | 5 | 0.12% | -576 | -13.35% | 4,316 |
| Oliver | 1,356 | 83.55% | 266 | 16.39% | 1 | 0.06% | 0 | 0.00% | 0 | 0.00% | 1,090 | 67.16% | 1,623 |
| Pembina | 2,924 | 43.94% | 3,711 | 55.76% | 11 | 0.17% | 1 | 0.02% | 8 | 0.12% | -787 | -11.83% | 6,655 |
| Pierce | 2,349 | 61.64% | 1,451 | 38.07% | 5 | 0.13% | 2 | 0.05% | 4 | 0.10% | 898 | 23.56% | 3,811 |
| Ramsey | 3,629 | 50.44% | 3,530 | 49.07% | 25 | 0.35% | 6 | 0.08% | 4 | 0.06% | 99 | 1.38% | 7,194 |
| Ransom | 2,579 | 56.20% | 1,986 | 43.28% | 19 | 0.41% | 3 | 0.07% | 2 | 0.04% | 593 | 12.92% | 4,589 |
| Renville | 1,202 | 47.03% | 1,298 | 50.78% | 48 | 1.88% | 8 | 0.31% | 0 | 0.00% | -96 | -3.76% | 2,556 |
| Richland | 5,102 | 58.42% | 3,584 | 41.04% | 32 | 0.37% | 6 | 0.07% | 10 | 0.11% | 1,518 | 17.38% | 8,734 |
| Rolette | 1,555 | 35.41% | 2,820 | 64.21% | 10 | 0.23% | 3 | 0.07% | 4 | 0.09% | -1,265 | -28.80% | 4,392 |
| Sargent | 1,922 | 50.01% | 1,894 | 49.28% | 21 | 0.55% | 1 | 0.03% | 5 | 0.13% | 28 | 0.73% | 3,843 |
| Sheridan | 2,405 | 81.33% | 543 | 18.36% | 2 | 0.07% | 7 | 0.24% | 0 | 0.00% | 1,862 | 62.97% | 2,957 |
| Sioux | 1,167 | 66.84% | 578 | 33.10% | 1 | 0.06% | 0 | 0.00% | 0 | 0.00% | 589 | 33.73% | 1,746 |
| Slope | 801 | 57.58% | 585 | 42.06% | 4 | 0.29% | 1 | 0.07% | 0 | 0.00% | 216 | 15.53% | 1,391 |
| Stark | 4,367 | 67.63% | 2,075 | 32.14% | 7 | 0.11% | 2 | 0.03% | 6 | 0.09% | 2,292 | 35.50% | 6,457 |
| Steele | 1,328 | 47.70% | 1,434 | 51.51% | 17 | 0.61% | 3 | 0.11% | 2 | 0.07% | -106 | -3.81% | 2,784 |
| Stutsman | 5,634 | 58.92% | 3,897 | 40.76% | 19 | 0.20% | 3 | 0.03% | 9 | 0.09% | 1,737 | 18.17% | 9,562 |
| Towner | 1,630 | 50.29% | 1,596 | 49.24% | 10 | 0.31% | 2 | 0.06% | 3 | 0.09% | 34 | 1.05% | 3,241 |
| Traill | 2,882 | 53.47% | 2,476 | 45.94% | 15 | 0.28% | 8 | 0.15% | 9 | 0.17% | 406 | 7.53% | 5,390 |
| Walsh | 3,051 | 35.61% | 5,499 | 64.18% | 4 | 0.05% | 1 | 0.01% | 13 | 0.15% | -2,448 | -28.57% | 8,568 |
| Ward | 6,519 | 45.61% | 7,669 | 53.66% | 67 | 0.47% | 13 | 0.09% | 25 | 0.17% | -1,150 | -8.05% | 14,293 |
| Wells | 3,335 | 63.74% | 1,878 | 35.89% | 13 | 0.25% | 1 | 0.02% | 5 | 0.10% | 1,457 | 27.85% | 5,232 |
| Williams | 2,470 | 34.25% | 4,579 | 63.50% | 121 | 1.68% | 31 | 0.43% | 10 | 0.14% | -2,109 | -29.25% | 7,211 |
| Total | 154,590 | 55.06% | 124,036 | 44.18% | 1,279 | 0.46% | 545 | 0.19% | 325 | 0.12% | 30,554 | 10.88% | 280,775 |
See also edit
References edit
- ^ "United States Presidential election of 1940 – Encyclopædia Britannica". Retrieved August 19, 2018.
- ^ "1940 Election for the Thirty-ninth Term (1941-45)". Retrieved August 19, 2018.
- ^ "1940 Presidential General Election Results – North Dakota". Retrieved August 19, 2018.
- ^ "The American Presidency Project – Election of 1940". Retrieved August 19, 2018.
- ^ "1940 Presidential Election Statistics". Dave Leip’s Atlas of U.S. Presidential Elections. Retrieved March 5, 2018.
- ^ "ND US President Race, November 05, 1940". Our Campaigns.