


Summary
The 1936 United States presidential election in South Dakota took place on November 3, 1936, as part of the 1936 United States presidential election. Voters chose four representatives, or electors to the Electoral College, who voted for president and vice president.
| ||||||||||||||||||||||||||
| ||||||||||||||||||||||||||
 County Results
| ||||||||||||||||||||||||||
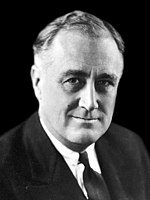

South Dakota voted for the Democratic candidate Franklin D. Roosevelt over Republican candidate Alf Landon. Roosevelt won the state by a margin of 11.53%. As of the 2020 presidential election[update], this is the last occasion when the following counties have voted for a Democratic Presidential candidate: Douglas, Fall River, Haakon, Harding, Hughes and Perkins.[1]
Primary elections edit
Democratic primary edit
Incumbent President Franklin D. Roosevelt ran unopposed in the Democratic primary, held on May 5, 1936.[2]
| 1936 South Dakota Democratic Primary - Results | |||
|---|---|---|---|
| Candidate | Votes | Percentage | Delegates |
| Franklin D. Roosevelt | 48,262 | 100.00% | 8 |
| Total | 48,262 | 100.00% | 8 |
Republican primary edit
U.S. Senator William Borah from Idaho and former South Dakota Governor Warren E. Green (leading a "No Preference" delegate list) faced off in the Republican primary, held on May 5, 1936.[2]
| 1936 South Dakota Republican Primary - Results | |||
|---|---|---|---|
| Candidate | Votes | Percentage | Delegates |
| Warren E. Green/No Preference | 44,518 | 50.14% | 8 |
| William Borah | 44,261 | 49.86% | 0 |
| Total | 88,779 | 100.00% | 8 |
Results edit
The general election was held on November 3, 1936. Armstrong County did not participate.
| 1936 United States presidential election in South Dakota[3] | ||||||
|---|---|---|---|---|---|---|
| Party | Candidate | Running mate | Votes | % | Electoral votes | |
| Democratic | Franklin D. Roosevelt | John Nance Garner | 160,137 | 54.02% | 4 | |
| Republican | Alf Landon | Frank Knox | 125,977 | 42.49% | 0 | |
| Independent | William Lemke | Thomas C. O'Brien | 10,338 | 3.49% | 0 | |
| Total | 296,452 | 100.0% | 4 | |||
Results by county edit
| County[4] | Franklin Delano Roosevelt Democratic |
Alfred Mossmann Landon Republican |
William Frederick Lemke Independent |
Margin | Total votes cast | ||||
|---|---|---|---|---|---|---|---|---|---|
| # | % | # | % | # | % | # | % | ||
| Aurora | 1,801 | 60.78% | 1,082 | 36.52% | 80 | 2.70% | 719 | 24.27% | 2,963 |
| Beadle | 5,843 | 64.84% | 2,965 | 32.90% | 203 | 2.25% | 2,878 | 31.94% | 9,011 |
| Bennett | 807 | 59.82% | 530 | 39.29% | 12 | 0.89% | 277 | 20.53% | 1,349 |
| Bon Homme | 2,959 | 55.84% | 2,236 | 42.20% | 104 | 1.96% | 723 | 13.64% | 5,299 |
| Brookings | 3,161 | 43.29% | 3,899 | 53.40% | 242 | 3.31% | -738 | -10.11% | 7,302 |
| Brown | 9,177 | 65.58% | 4,505 | 32.19% | 311 | 2.22% | 4,672 | 33.39% | 13,993 |
| Brule | 2,274 | 68.56% | 982 | 29.61% | 61 | 1.84% | 1,292 | 38.95% | 3,317 |
| Buffalo | 410 | 51.57% | 368 | 46.29% | 17 | 2.14% | 42 | 5.28% | 795 |
| Butte | 1,519 | 48.30% | 1,525 | 48.49% | 101 | 3.21% | -6 | -0.19% | 3,145 |
| Campbell | 736 | 36.31% | 1,236 | 60.98% | 55 | 2.71% | -500 | -24.67% | 2,027 |
| Charles Mix | 4,628 | 66.96% | 2,209 | 31.96% | 75 | 1.09% | 2,419 | 35.00% | 6,912 |
| Clark | 2,036 | 49.82% | 1,883 | 46.07% | 168 | 4.11% | 153 | 3.74% | 4,087 |
| Clay | 3,070 | 60.97% | 1,692 | 33.60% | 273 | 5.42% | 1,378 | 27.37% | 5,035 |
| Codington | 4,256 | 55.85% | 3,005 | 39.44% | 359 | 4.71% | 1,251 | 16.42% | 7,620 |
| Corson | 1,781 | 54.05% | 1,408 | 42.73% | 106 | 3.22% | 373 | 11.32% | 3,295 |
| Custer | 1,519 | 52.16% | 1,365 | 46.88% | 28 | 0.96% | 154 | 5.29% | 2,912 |
| Davison | 4,983 | 63.84% | 2,510 | 32.16% | 312 | 4.00% | 2,473 | 31.68% | 7,805 |
| Day | 3,335 | 58.21% | 2,113 | 36.88% | 281 | 4.90% | 1,222 | 21.33% | 5,729 |
| Deuel | 1,440 | 45.67% | 1,595 | 50.59% | 118 | 3.74% | -155 | -4.92% | 3,153 |
| Dewey | 1,216 | 53.17% | 1,012 | 44.25% | 59 | 2.58% | 204 | 8.92% | 2,287 |
| Douglas | 1,680 | 53.01% | 1,418 | 44.75% | 71 | 2.24% | 262 | 8.27% | 3,169 |
| Edmunds | 2,030 | 52.21% | 1,818 | 46.76% | 40 | 1.03% | 212 | 5.45% | 3,888 |
| Fall River | 1,927 | 48.39% | 1,876 | 47.11% | 179 | 4.50% | 51 | 1.28% | 3,982 |
| Faulk | 1,404 | 54.95% | 1,111 | 43.48% | 40 | 1.57% | 293 | 11.47% | 2,555 |
| Grant | 2,101 | 51.76% | 1,847 | 45.50% | 111 | 2.73% | 254 | 6.26% | 4,059 |
| Gregory | 2,603 | 57.27% | 1,868 | 41.10% | 74 | 1.63% | 735 | 16.17% | 4,545 |
| Haakon | 948 | 48.47% | 933 | 47.70% | 75 | 3.83% | 15 | 0.77% | 1,956 |
| Hamlin | 1,622 | 45.64% | 1,857 | 52.25% | 75 | 2.11% | -235 | -6.61% | 3,554 |
| Hand | 1,721 | 53.17% | 1,289 | 39.82% | 227 | 7.01% | 432 | 13.35% | 3,237 |
| Hanson | 1,530 | 56.50% | 1,090 | 40.25% | 88 | 3.25% | 440 | 16.25% | 2,708 |
| Harding | 819 | 59.26% | 524 | 37.92% | 39 | 2.82% | 295 | 21.35% | 1,382 |
| Hughes | 1,662 | 50.18% | 1,547 | 46.71% | 103 | 3.11% | 115 | 3.47% | 3,312 |
| Hutchinson | 2,500 | 43.10% | 2,804 | 48.34% | 497 | 8.57% | -304 | -5.24% | 5,801 |
| Hyde | 683 | 45.11% | 795 | 52.51% | 36 | 2.38% | -112 | -7.40% | 1,514 |
| Jackson | 593 | 53.71% | 481 | 43.57% | 30 | 2.72% | 112 | 10.14% | 1,104 |
| Jerauld | 1,343 | 53.63% | 1,075 | 42.93% | 86 | 3.43% | 268 | 10.70% | 2,504 |
| Jones | 620 | 49.05% | 608 | 48.10% | 36 | 2.85% | 12 | 0.95% | 1,264 |
| Kingsbury | 2,037 | 40.13% | 2,813 | 55.42% | 226 | 4.45% | -776 | -15.29% | 5,076 |
| Lake | 2,520 | 41.94% | 3,182 | 52.95% | 307 | 5.11% | -662 | -11.02% | 6,009 |
| Lawrence | 3,809 | 43.03% | 4,974 | 56.19% | 69 | 0.78% | -1,165 | -13.16% | 8,852 |
| Lincoln | 2,541 | 42.17% | 2,918 | 48.42% | 567 | 9.41% | -377 | -6.26% | 6,026 |
| Lyman | 1,321 | 54.14% | 1,090 | 44.67% | 29 | 1.19% | 231 | 9.47% | 2,440 |
| Marshall | 2,220 | 65.54% | 1,105 | 32.62% | 62 | 1.83% | 1,115 | 32.92% | 3,387 |
| McCook | 2,536 | 52.28% | 2,117 | 43.64% | 198 | 4.08% | 419 | 8.64% | 4,851 |
| McPherson | 1,556 | 44.39% | 1,921 | 54.81% | 28 | 0.80% | -365 | -10.41% | 3,505 |
| Meade | 2,304 | 49.91% | 2,064 | 44.71% | 248 | 5.37% | 240 | 5.20% | 4,616 |
| Mellette | 808 | 52.91% | 711 | 46.56% | 8 | 0.52% | 97 | 6.35% | 1,527 |
| Miner | 2,051 | 57.74% | 1,377 | 38.77% | 124 | 3.49% | 674 | 18.98% | 3,552 |
| Minnehaha | 13,174 | 49.70% | 12,418 | 46.85% | 916 | 3.46% | 756 | 2.85% | 26,508 |
| Moody | 2,366 | 51.89% | 1,992 | 43.68% | 202 | 4.43% | 374 | 8.20% | 4,560 |
| Pennington | 5,557 | 53.29% | 4,442 | 42.60% | 429 | 4.11% | 1,115 | 10.69% | 10,428 |
| Perkins | 1,940 | 56.64% | 1,408 | 41.11% | 77 | 2.25% | 532 | 15.53% | 3,425 |
| Potter | 1,338 | 58.02% | 914 | 39.64% | 54 | 2.34% | 424 | 18.39% | 2,306 |
| Roberts | 3,820 | 64.19% | 1,934 | 32.50% | 197 | 3.31% | 1,886 | 31.69% | 5,951 |
| Sanborn | 1,919 | 59.89% | 1,174 | 36.64% | 111 | 3.46% | 745 | 23.25% | 3,204 |
| Shannon | 634 | 47.46% | 667 | 49.93% | 35 | 2.62% | -33 | -2.47% | 1,336 |
| Spink | 3,569 | 60.79% | 2,078 | 35.39% | 224 | 3.82% | 1,491 | 25.40% | 5,871 |
| Stanley | 629 | 53.49% | 495 | 42.09% | 52 | 4.42% | 134 | 11.39% | 1,176 |
| Sully | 437 | 38.40% | 667 | 58.61% | 34 | 2.99% | -230 | -20.21% | 1,138 |
| Todd | 1,318 | 67.04% | 624 | 31.74% | 24 | 1.22% | 694 | 35.30% | 1,966 |
| Tripp | 2,708 | 60.38% | 1,693 | 37.75% | 84 | 1.87% | 1,015 | 22.63% | 4,485 |
| Turner | 2,923 | 44.79% | 3,214 | 49.25% | 389 | 5.96% | -291 | -4.46% | 6,526 |
| Union | 3,520 | 60.85% | 1,845 | 31.89% | 420 | 7.26% | 1,675 | 28.95% | 5,785 |
| Walworth | 2,212 | 60.34% | 1,420 | 38.73% | 34 | 0.93% | 792 | 21.60% | 3,666 |
| Washabaugh | 313 | 55.79% | 238 | 42.42% | 10 | 1.78% | 75 | 13.37% | 561 |
| Washington | 234 | 59.69% | 158 | 40.31% | 0 | 0.00% | 76 | 19.39% | 392 |
| Yankton | 4,349 | 58.47% | 2,702 | 36.33% | 387 | 5.20% | 1,647 | 22.14% | 7,438 |
| Ziebach | 737 | 55.46% | 561 | 42.21% | 31 | 2.33% | 176 | 13.24% | 1,329 |
| Armstrong[a] | 0 | N/A | 0 | N/A | 0 | N/A | N/A | N/A | 0 |
| Totals | 160,137 | 54.02% | 125,977 | 42.49% | 10,348 | 3.49% | 34,160 | 11.52% | 296,462 |
See also edit
Notes edit
References edit
- ^ Sullivan, Robert David; ‘How the Red and Blue Map Evolved Over the Past Century’; America Magazine in The National Catholic Review; June 29, 2016
- ^ a b South Dakota Department of Finance. South Dakota legislative manual 1937. pp. 382–384.
- ^ "1936 Presidential General Election Results - South Dakota". Retrieved November 4, 2018.
- ^ Scammon, Richard M. (compiler); America at the Polls: A Handbook of Presidential Election Statistics 1920-1964; pp. 404-405 ISBN 0405077114
- ^ Scammon (editor); America at the Polls, p. 412