


Summary
The 1928 United States presidential election in Vermont took place on November 6, 1928, as part of the 1928 United States presidential election which was held throughout all contemporary 48 states. Voters chose four representatives, or electors to the Electoral College, who voted for president and vice president.
| ||||||||||||||||||||||||||
| ||||||||||||||||||||||||||


| ||||||||||||||||||||||||||
| ||||||||||||||||||||||||||
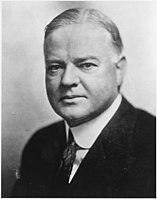
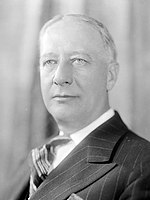
Vermont voted for the Republican nominee, former Secretary of Commerce Herbert Hoover of California, over the Democratic nominee, Governor Alfred E. Smith of New York. Hoover's running mate was Senate Majority Leader Charles Curtis of Kansas, while Smith ran with Senator Joseph Taylor Robinson of Arkansas.
Hoover took 66.87% of the vote, to Smith's 32.87%, a margin of 34%. Vermont historically was a bastion of Northeastern Republicanism, and by 1928 it had gone Republican in every presidential election since the founding of the Republican Party. From 1856 to 1924, Vermont had had the longest streak of voting Republican of any state, having never voted Democratic before, and this tradition continued amidst a third consecutive nationwide Republican landslide in 1928.
While Hoover won the state in a decisive landslide, Smith's performance nevertheless represented a dramatic Democratic improvement in the state. In 1924, Vermont had been the most Republican state in the union, with Republican Calvin Coolidge winning 78.22% to only 15.67% for Democrat John W. Davis, a massive margin of 62.55%. Vermont, like New England and the Northeast as a whole, swung strongly toward the Democrats in 1928, even as Hoover won another decisive Republican victory nationally. Thus in the 1928 election, Vermont fell to being only the fifth most Republican state in the nation after Kansas, Michigan, Maine and Washington, about 16% more Republican than the national average.[1]
Hoover carried thirteen of the state's fourteen counties, many by large margins. However, the three northwestern counties of Vermont would by 1932 become staunch Democratic enclaves in an otherwise Republican state, and in 1928 movement toward the Democratic Party in this region would first manifest itself, as Smith won over the votes of urban and ethnic Catholic working-class voters. In 1928, Smith became the first Democrat to win Chittenden County, the state's most populous county, home to the state's largest city, Burlington. Just four years earlier, in 1924,[2] Republican Calvin Coolidge had received over 70% of the vote in the county.[3] Consequently, Hoover became the first Republican to ever win without Chittenden County. This is the last election in which Vermont had more than three electoral votes as it would lose its 2nd district in the 1930 census and has maintained an at large district ever since.
Results edit
| 1928 United States presidential election in Vermont[4] | |||||
|---|---|---|---|---|---|
| Party | Candidate | Votes | Percentage | Electoral votes | |
| Republican | Herbert Hoover | 90,404 | 66.87% | 3 | |
| Democratic | Alfred E. Smith | 44,440 | 32.87% | 0 | |
| Prohibition | William F. Varney | 338 | 0.25% | 0 | |
| N/A | Write-ins | 9 | 0.01% | 0 | |
| Totals | 135,191 | 100.00% | 4 | ||
Results by county edit
| County | Herbert Clark Hoover Republican |
Alfred Emmanuel Smith Democratic |
Various candidates Other parties |
Margin | Total votes cast[5] | ||||
|---|---|---|---|---|---|---|---|---|---|
| # | % | # | % | # | % | # | % | ||
| Addison | 5,247 | 72.09% | 2,003 | 27.52% | 28 | 0.38% | 3,244 | 44.57% | 7,278 |
| Bennington | 6,114 | 63.49% | 3,498 | 36.32% | 18 | 0.19% | 2,616 | 27.17% | 9,630 |
| Caledonia | 6,616 | 78.07% | 1,832 | 21.62% | 26 | 0.31% | 4,784 | 56.46% | 8,474 |
| Chittenden | 8,156 | 47.32% | 9,052 | 52.52% | 27 | 0.16% | -896 | -5.20% | 17,235 |
| Essex | 1,703 | 67.74% | 805 | 32.02% | 6 | 0.24% | 898 | 35.72% | 2,514 |
| Franklin | 6,031 | 52.23% | 5,477 | 47.43% | 40 | 0.35% | 554 | 4.80% | 11,548 |
| Grand Isle | 830 | 50.55% | 801 | 48.78% | 11 | 0.67% | 29 | 1.77% | 1,642 |
| Lamoille | 3,262 | 84.64% | 576 | 14.95% | 16 | 0.42% | 2,686 | 69.69% | 3,854 |
| Orange | 5,223 | 84.69% | 914 | 14.82% | 30 | 0.49% | 4,309 | 69.87% | 6,167 |
| Orleans | 5,561 | 80.65% | 1,320 | 19.14% | 14 | 0.20% | 4,241 | 61.51% | 6,895 |
| Rutland | 12,621 | 59.36% | 8,609 | 40.49% | 32 | 0.15% | 4,012 | 18.87% | 21,262 |
| Washington | 9,891 | 68.91% | 4,408 | 30.71% | 54 | 0.38% | 5,483 | 38.20% | 14,353 |
| Windham | 8,410 | 77.70% | 2,398 | 22.15% | 16 | 0.15% | 6,012 | 55.54% | 10,824 |
| Windsor | 10,739 | 79.46% | 2,747 | 20.33% | 29 | 0.21% | 7,992 | 59.13% | 13,515 |
| Totals | 90,404 | 66.87% | 44,440 | 32.87% | 347 | 0.26% | 45,964 | 34.00% | 135,191 |
See also edit
References edit
- ^ "1928 Presidential Election Statistics". Dave Leip’s Atlas of U.S. Presidential Elections. Retrieved March 5, 2018.
- ^ Menendez, Albert J.; The Geography of Presidential Elections in the United States, 1868-2004, p. 60 ISBN 0786422173
- ^ Menendez; The Geography of Presidential Elections in the United States, pp. 321-322
- ^ "1928 Presidential General Election Results - Vermont". Dave Leip's Atlas of U.S. Presidential Elections. Retrieved August 2, 2013.
- ^ Robinson, Edgar Eugene; The Presidential Vote 1896-1932, pp. 352-354 ISBN 9780804716963