


Summary
The 1928 United States presidential election in Texas took place on November 6, 1928, as part of the 1928 United States presidential election which was held throughout all contemporary forty-eight states. Voters chose 20 representatives, or electors, to the Electoral College, who voted for president and vice president.
| ||||||||||||||||||||||||||
| ||||||||||||||||||||||||||
 County Results
| ||||||||||||||||||||||||||
| ||||||||||||||||||||||||||
Ever since statehood, Texas had been one of the strongest states in the nation for the Democratic Party, owing to its early history as a southern state state based around slavery. Even during Reconstruction when African Americans were briefly enfranchised, the Republican Party won just one statewide election. By the time Texas participated in its first postbellum election in 1872, cracks were emerging in Republican Reconstruction plans, so that the Democratic "Redeemers" gained control of Southern legislatures by 1874.[1]
After "Redemption" and the passing of a new constitution in 1876 the GOP became confined largely to areas of abolitionist German "Forty-Eighter" settlement in the Hill Country,[2] and to a few South Texas counties where local Republican bosses could outcompete their Democratic equivalents.[3] The Terrell Election Law created a poll tax that, from 1902, disenfranchised virtually all remaining African-American voters, the vast majority of Mexican Americans, and also most poor whites.[4] Voter turnout among males over twenty-one fell from over eighty percent to under thirty percent following introduction of the poll tax.[5] The period following this disfranchisement nonetheless saw a substantial amount of typically "Progressive" reform under Governors James Stephen Hogg and Thomas M. Campbell, and despite this progressive faction ceding power in 1906 to the conservatives, Texas proved solid in its support for progressive candidate Woodrow Wilson at the 1912 Democratic National Convention.[6] In the meantime, Texas continued to vote solidly Democratic: between 1904 and 1924 no Republican nominee reached 24% of the statewide vote total.[7]
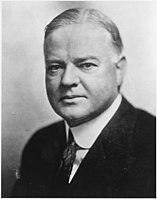
Hoover won Texas by a narrow margin of 3.67 percent. His victory in the state made him the first Republican presidential candidate to carry Texas.[a] He produced a swing of over 32 percent compared to the vote for Calvin Coolidge in 1924; however, there were huge variations. The traditionally Republican Texas German counties of Comal and Guadalupe, along with the former 1920 Ferguson counties of Lee and Washington voted overwhelmingly for Smith in appreciation of his views on Prohibition:[9] in Comal County, which had been Robert La Follette's strongest nationwide in 1924,[10] the Democratic vote rose from 13 to 78%, thus supporting La Follette's family's endorsement of Smith after he died.
In contrast, numerous Baptist High Plains counties saw Hoover gain over fifty percent relative to Coolidge due to vehement opposition to Catholicism and repeal of Prohibition.[11] Hoover was also helped by a powerful vote from the emerging middle class in Dallas–Fort Worth and Houston:[12] his combined margin in Harris, Dallas and Tarrant Counties was slightly larger than his statewide plurality.[13] East Texas, the earliest-settled region of the state with greatest white resentment of the Republican Party's association with Reconstruction, and South Texas, in which white voters had similar fears of Mexican-American political power, remained normally loyal to Smith.[14]
Texas wouldn't support another Republican presidential candidate until 1952 when Texan-born Dwight D. Eisenhower carried the state. As of the 2020 presidential election[update], this is the last election in which Maverick County voted for a Republican presidential candidate.[15]
Results edit
| 1928 United States presidential election in Texas[16] | |||||
|---|---|---|---|---|---|
| Party | Candidate | Votes | Percentage | Electoral votes | |
| Republican | Herbert Hoover | 367,036 | 51.77% | 20 | |
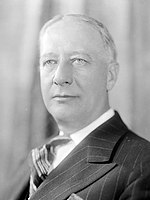
| Democratic | Al Smith | 341,032 | 48.10% | 0 | |
| Socialist | Norman Thomas | 722 | 0.10% | 0 | |
| Communist | William Z. Foster | 209 | 0.03% | 0 | |
| Totals | 708,999 | 100.00% | 20 | ||
| Voter turnout (voting age) | 24.8%[17] | ||||
Results by county edit
| County | Herbert Hoover Republican |
Al Smith Democratic |
Various candidates Other parties |
Margin | Total votes cast | ||||
|---|---|---|---|---|---|---|---|---|---|
| # | % | # | % | # | % | # | % | ||
| Anderson | 1,814 | 50.94% | 1,747 | 49.06% | 0 | 0.00% | 67 | 1.88% | 3,561 |
| Andrews | 66 | 72.53% | 25 | 27.47% | 0 | 0.00% | 41 | 45.05% | 91 |
| Angelina | 1,209 | 34.41% | 2,305 | 65.59% | 0 | 0.00% | -1,096 | -31.19% | 3,514 |
| Aransas | 161 | 51.44% | 152 | 48.56% | 0 | 0.00% | 9 | 2.88% | 313 |
| Archer | 799 | 48.02% | 865 | 51.98% | 0 | 0.00% | -66 | -3.97% | 1,664 |
| Armstrong | 316 | 45.80% | 373 | 54.06% | 1 | 0.14% | -57 | -8.26% | 690 |
| Atascosa | 888 | 56.56% | 682 | 43.44% | 0 | 0.00% | 206 | 13.12% | 1,570 |
| Austin | 466 | 17.94% | 2,129 | 81.98% | 2 | 0.08% | -1,663 | -64.04% | 2,597 |
| Bailey | 410 | 74.28% | 142 | 25.72% | 0 | 0.00% | 268 | 48.55% | 552 |
| Bandera | 936 | 74.52% | 317 | 25.24% | 3 | 0.24% | 619 | 49.28% | 1,256 |
| Bastrop | 850 | 35.65% | 1,534 | 64.35% | 0 | 0.00% | -684 | -28.69% | 2,384 |
| Baylor | 491 | 38.51% | 784 | 61.49% | 0 | 0.00% | -293 | -22.98% | 1,275 |
| Bee | 1,189 | 53.18% | 1,043 | 46.65% | 4 | 0.18% | 146 | 6.53% | 2,236 |
| Bell | 3,366 | 52.17% | 3,079 | 47.72% | 7 | 0.11% | 287 | 4.45% | 6,452 |
| Bexar | 16,477 | 49.69% | 16,626 | 50.14% | 57 | 0.17% | -149 | -0.45% | 33,160 |
| Blanco | 615 | 53.25% | 539 | 46.67% | 1 | 0.09% | 76 | 6.58% | 1,155 |
| Borden | 98 | 57.31% | 73 | 42.69% | 0 | 0.00% | 25 | 14.62% | 171 |
| Bosque | 1,526 | 55.19% | 1,235 | 44.67% | 4 | 0.14% | 291 | 10.52% | 2,765 |
| Bowie | 2,225 | 42.57% | 3,002 | 57.43% | 0 | 0.00% | -777 | -14.87% | 5,227 |
| Brazoria | 1,588 | 59.39% | 1,086 | 40.61% | 0 | 0.00% | 502 | 18.77% | 2,674 |
| Brazos | 738 | 33.23% | 1,480 | 66.64% | 3 | 0.14% | -742 | -33.41% | 2,221 |
| Brewster | 406 | 59.36% | 273 | 39.91% | 5 | 0.73% | 133 | 19.44% | 684 |
| Briscoe | 301 | 46.96% | 336 | 52.42% | 4 | 0.62% | -35 | -5.46% | 641 |
| Brooks | 160 | 32.52% | 332 | 67.48% | 0 | 0.00% | -172 | -34.96% | 492 |
| Brown | 2,033 | 50.46% | 1,992 | 49.44% | 4 | 0.10% | 41 | 1.02% | 4,029 |
| Burleson | 339 | 17.87% | 1,558 | 82.13% | 0 | 0.00% | -1,219 | -64.26% | 1,897 |
| Burnet | 936 | 66.67% | 467 | 33.26% | 1 | 0.07% | 469 | 33.40% | 1,404 |
| Caldwell | 1,189 | 49.54% | 1,211 | 50.46% | 0 | 0.00% | -22 | -0.92% | 2,400 |
| Calhoun | 333 | 46.84% | 375 | 52.74% | 3 | 0.42% | -42 | -5.91% | 711 |
| Callahan | 979 | 51.02% | 940 | 48.98% | 0 | 0.00% | 39 | 2.03% | 1,919 |
| Cameron | 3,544 | 52.45% | 3,202 | 47.39% | 11 | 0.16% | 342 | 5.06% | 6,757 |
| Camp | 494 | 43.56% | 640 | 56.44% | 0 | 0.00% | -146 | -12.87% | 1,134 |
| Carson | 891 | 60.04% | 592 | 39.89% | 1 | 0.07% | 299 | 20.15% | 1,484 |
| Cass | 1,323 | 43.79% | 1,698 | 56.21% | 0 | 0.00% | -375 | -12.41% | 3,021 |
| Castro | 319 | 45.38% | 384 | 54.62% | 0 | 0.00% | -65 | -9.25% | 703 |
| Chambers | 256 | 51.41% | 242 | 48.59% | 0 | 0.00% | 14 | 2.81% | 498 |
| Cherokee | 1,933 | 49.94% | 1,938 | 50.06% | 0 | 0.00% | -5 | -0.13% | 3,871 |
| Childress | 1,438 | 66.45% | 726 | 33.55% | 0 | 0.00% | 712 | 32.90% | 2,164 |
| Clay | 1,327 | 53.36% | 1,160 | 46.64% | 0 | 0.00% | 167 | 6.71% | 2,487 |
| Cochran | 197 | 64.38% | 109 | 35.62% | 0 | 0.00% | 88 | 28.76% | 306 |
| Coke | 450 | 68.60% | 206 | 31.40% | 0 | 0.00% | 244 | 37.20% | 656 |
| Coleman | 1,645 | 53.00% | 1,459 | 47.00% | 0 | 0.00% | 186 | 5.99% | 3,104 |
| Collin | 3,476 | 50.55% | 3,377 | 49.11% | 23 | 0.33% | 99 | 1.44% | 6,876 |
| Collingsworth | 1,179 | 65.98% | 608 | 34.02% | 0 | 0.00% | 571 | 31.95% | 1,787 |
| Colorado | 891 | 33.22% | 1,787 | 66.63% | 4 | 0.15% | -896 | -33.41% | 2,682 |
| Comal | 508 | 21.14% | 1,893 | 78.78% | 2 | 0.08% | -1,385 | -57.64% | 2,403 |
| Comanche | 1,483 | 53.08% | 1,311 | 46.92% | 0 | 0.00% | 172 | 6.16% | 2,794 |
| Concho | 446 | 50.97% | 426 | 48.69% | 3 | 0.34% | 20 | 2.29% | 875 |
| Cooke | 2,262 | 53.99% | 1,924 | 45.92% | 4 | 0.10% | 338 | 8.07% | 4,190 |
| Coryell | 1,123 | 46.21% | 1,306 | 53.74% | 1 | 0.04% | -183 | -7.53% | 2,430 |
| Cottle | 473 | 51.19% | 451 | 48.81% | 0 | 0.00% | 22 | 2.38% | 924 |
| Crane | 127 | 44.41% | 159 | 55.59% | 0 | 0.00% | -32 | -11.19% | 286 |
| Crockett | 291 | 81.97% | 64 | 18.03% | 0 | 0.00% | 227 | 63.94% | 355 |
| Crosby | 1,004 | 57.97% | 728 | 42.03% | 0 | 0.00% | 276 | 15.94% | 1,732 |
| Culberson | 72 | 45.86% | 85 | 54.14% | 0 | 0.00% | -13 | -8.28% | 157 |
| Dallam | 618 | 53.00% | 539 | 46.23% | 9 | 0.77% | 79 | 6.78% | 1,166 |
| Dallas | 27,272 | 60.89% | 17,437 | 38.93% | 78 | 0.17% | 9,835 | 21.96% | 44,787 |
| Dawson | 1,448 | 77.23% | 427 | 22.77% | 0 | 0.00% | 1,021 | 54.45% | 1,875 |
| Deaf Smith | 570 | 58.10% | 411 | 41.90% | 0 | 0.00% | 159 | 16.21% | 981 |
| Delta | 753 | 43.96% | 958 | 55.93% | 2 | 0.12% | -205 | -11.97% | 1,713 |
| Denton | 2,587 | 51.89% | 2,384 | 47.81% | 15 | 0.30% | 203 | 4.07% | 4,986 |
| DeWitt | 1,142 | 41.66% | 1,594 | 58.15% | 5 | 0.18% | -452 | -16.49% | 2,741 |
| Dickens | 741 | 64.10% | 415 | 35.90% | 0 | 0.00% | 326 | 28.20% | 1,156 |
| Dimmit | 626 | 70.81% | 258 | 29.19% | 0 | 0.00% | 368 | 41.63% | 884 |
| Donley | 1,092 | 68.90% | 491 | 30.98% | 2 | 0.13% | 601 | 37.92% | 1,585 |
| Duval | 434 | 25.85% | 1,245 | 74.15% | 0 | 0.00% | -811 | -48.30% | 1,679 |
| Eastland | 3,233 | 56.38% | 2,501 | 43.62% | 0 | 0.00% | 732 | 12.77% | 5,734 |
| Ector | 168 | 52.66% | 151 | 47.34% | 0 | 0.00% | 17 | 5.33% | 319 |
| Edwards | 546 | 89.66% | 59 | 9.69% | 4 | 0.66% | 487 | 79.97% | 609 |
| Ellis | 3,569 | 44.72% | 4,399 | 55.12% | 13 | 0.16% | -830 | -10.40% | 7,981 |
| El Paso | 6,050 | 49.74% | 6,114 | 50.26% | 0 | 0.00% | -64 | -0.53% | 12,164 |
| Erath | 1,923 | 56.94% | 1,372 | 40.63% | 82 | 2.43% | 551 | 16.32% | 3,377 |
| Falls | 877 | 26.04% | 2,484 | 73.75% | 7 | 0.21% | -1,607 | -47.71% | 3,368 |
| Fannin | 2,122 | 45.62% | 2,525 | 54.29% | 4 | 0.09% | -403 | -8.66% | 4,651 |
| Fayette | 689 | 15.87% | 3,647 | 84.01% | 5 | 0.12% | -2,958 | -68.14% | 4,341 |
| Fisher | 1,259 | 60.07% | 837 | 39.93% | 0 | 0.00% | 422 | 20.13% | 2,096 |
| Floyd | 1,176 | 63.84% | 666 | 36.16% | 0 | 0.00% | 510 | 27.69% | 1,842 |
| Foard | 430 | 47.51% | 466 | 51.49% | 9 | 0.99% | -36 | -3.98% | 905 |
| Fort Bend | 631 | 26.77% | 1,724 | 73.14% | 2 | 0.08% | -1,093 | -46.37% | 2,357 |
| Franklin | 386 | 35.12% | 713 | 64.88% | 0 | 0.00% | -327 | -29.75% | 1,099 |
| Freestone | 1,178 | 47.14% | 1,318 | 52.74% | 3 | 0.12% | -140 | -5.60% | 2,499 |
| Frio | 673 | 72.21% | 258 | 27.68% | 1 | 0.11% | 415 | 44.53% | 932 |
| Gaines | 312 | 69.03% | 140 | 30.97% | 0 | 0.00% | 172 | 38.05% | 452 |
| Galveston | 4,401 | 42.43% | 5,951 | 57.38% | 20 | 0.19% | -1,550 | -14.94% | 10,372 |
| Garza | 794 | 73.59% | 285 | 26.41% | 0 | 0.00% | 509 | 47.17% | 1,079 |
| Gillespie | 1,447 | 55.12% | 1,174 | 44.72% | 4 | 0.15% | 273 | 10.40% | 2,625 |
| Glasscock | 124 | 78.48% | 34 | 21.52% | 0 | 0.00% | 90 | 56.96% | 158 |
| Goliad | 554 | 54.10% | 468 | 45.70% | 2 | 0.20% | 86 | 8.40% | 1,024 |
| Gonzales | 1,112 | 45.74% | 1,319 | 54.26% | 0 | 0.00% | -207 | -8.52% | 2,431 |
| Gray | 1,871 | 65.35% | 986 | 34.44% | 6 | 0.21% | 885 | 30.91% | 2,863 |
| Grayson | 6,277 | 57.63% | 4,600 | 42.23% | 15 | 0.14% | 1,677 | 15.40% | 10,892 |
| Gregg | 646 | 39.29% | 996 | 60.58% | 2 | 0.12% | -350 | -21.29% | 1,644 |
| Grimes | 701 | 37.37% | 1,175 | 62.63% | 0 | 0.00% | -474 | -25.27% | 1,876 |
| Guadalupe | 1,442 | 43.46% | 1,872 | 56.42% | 4 | 0.12% | -430 | -12.96% | 3,318 |
| Hale | 2,143 | 65.98% | 1,098 | 33.81% | 7 | 0.22% | 1,045 | 32.17% | 3,248 |
| Hall | 1,409 | 74.08% | 493 | 25.92% | 0 | 0.00% | 916 | 48.16% | 1,902 |
| Hamilton | 927 | 48.38% | 989 | 51.62% | 0 | 0.00% | -62 | -3.24% | 1,916 |
| Hansford | 417 | 56.58% | 319 | 43.28% | 1 | 0.14% | 98 | 13.30% | 737 |
| Hardeman | 1,333 | 59.43% | 910 | 40.57% | 0 | 0.00% | 423 | 18.86% | 2,243 |
| Hardin | 951 | 47.96% | 1,032 | 52.04% | 0 | 0.00% | -81 | -4.08% | 1,983 |
| Harris | 27,188 | 55.70% | 21,536 | 44.12% | 86 | 0.18% | 5,652 | 11.58% | 48,810 |
| Harrison | 1,776 | 46.69% | 2,023 | 53.18% | 5 | 0.13% | -247 | -6.49% | 3,804 |
| Hartley | 179 | 52.34% | 163 | 47.66% | 0 | 0.00% | 16 | 4.68% | 342 |
| Haskell | 1,430 | 48.08% | 1,532 | 51.51% | 12 | 0.40% | -102 | -3.43% | 2,974 |
| Hays | 1,088 | 63.70% | 620 | 36.30% | 0 | 0.00% | 468 | 27.40% | 1,708 |
| Hemphill | 489 | 60.67% | 317 | 39.33% | 0 | 0.00% | 172 | 21.34% | 806 |
| Henderson | 1,128 | 39.52% | 1,726 | 60.48% | 0 | 0.00% | -598 | -20.95% | 2,854 |
| Hidalgo | 4,285 | 51.41% | 4,034 | 48.40% | 16 | 0.19% | 251 | 3.01% | 8,335 |
| Hill | 2,446 | 50.34% | 2,413 | 49.66% | 0 | 0.00% | 33 | 0.68% | 4,859 |
| Hockley | 765 | 75.82% | 235 | 23.29% | 9 | 0.89% | 530 | 52.53% | 1,009 |
| Hood | 640 | 57.09% | 479 | 42.73% | 2 | 0.18% | 161 | 14.36% | 1,121 |
| Hopkins | 1,767 | 48.85% | 1,845 | 51.01% | 5 | 0.14% | -78 | -2.16% | 3,617 |
| Houston | 763 | 36.35% | 1,336 | 63.65% | 0 | 0.00% | -573 | -27.30% | 2,099 |
| Howard | 812 | 54.86% | 665 | 44.93% | 3 | 0.20% | 147 | 9.93% | 1,480 |
| Hudspeth | 123 | 51.25% | 117 | 48.75% | 0 | 0.00% | 6 | 2.50% | 240 |
| Hunt | 3,009 | 46.16% | 3,510 | 53.84% | 0 | 0.00% | -501 | -7.69% | 6,519 |
| Hutchinson | 1,115 | 60.43% | 730 | 39.57% | 0 | 0.00% | 385 | 20.87% | 1,845 |
| Irion | 259 | 68.52% | 119 | 31.48% | 0 | 0.00% | 140 | 37.04% | 378 |
| Jack | 1,068 | 70.22% | 450 | 29.59% | 3 | 0.20% | 618 | 40.63% | 1,521 |
| Jackson | 572 | 54.68% | 473 | 45.22% | 1 | 0.10% | 99 | 9.46% | 1,046 |
| Jasper | 611 | 40.44% | 898 | 59.43% | 2 | 0.13% | -287 | -18.99% | 1,511 |
| Jeff Davis | 157 | 58.15% | 112 | 41.48% | 1 | 0.37% | 45 | 16.67% | 270 |
| Jefferson | 9,209 | 56.74% | 7,006 | 43.16% | 16 | 0.10% | 2,203 | 13.57% | 16,231 |
| Jim Hogg | 109 | 29.30% | 263 | 70.70% | 0 | 0.00% | -154 | -41.40% | 372 |
| Jim Wells | 423 | 36.06% | 747 | 63.68% | 3 | 0.26% | -324 | -27.62% | 1,173 |
| Johnson | 3,181 | 61.58% | 1,981 | 38.35% | 4 | 0.08% | 1,200 | 23.23% | 5,166 |
| Jones | 1,995 | 55.95% | 1,563 | 43.83% | 8 | 0.22% | 432 | 12.11% | 3,566 |
| Karnes | 855 | 44.83% | 1,052 | 55.17% | 0 | 0.00% | -197 | -10.33% | 1,907 |
| Kaufman | 1,718 | 39.27% | 2,657 | 60.73% | 0 | 0.00% | -939 | -21.46% | 4,375 |
| Kendall | 663 | 63.63% | 377 | 36.18% | 2 | 0.19% | 286 | 27.45% | 1,042 |
| Kenedy | 12 | 9.23% | 118 | 90.77% | 0 | 0.00% | -106 | -81.54% | 130 |
| Kent | 363 | 69.01% | 163 | 30.99% | 0 | 0.00% | 200 | 38.02% | 526 |
| Kerr | 1,575 | 73.36% | 570 | 26.55% | 2 | 0.09% | 1,005 | 46.81% | 2,147 |
| Kimble | 660 | 80.39% | 157 | 19.12% | 4 | 0.49% | 503 | 61.27% | 821 |
| King | 85 | 65.38% | 45 | 34.62% | 0 | 0.00% | 40 | 30.77% | 130 |
| Kinney | 182 | 47.64% | 200 | 52.36% | 0 | 0.00% | -18 | -4.71% | 382 |
| Kleberg | 751 | 51.94% | 695 | 48.06% | 0 | 0.00% | 56 | 3.87% | 1,446 |
| Knox | 992 | 55.70% | 784 | 44.02% | 5 | 0.28% | 208 | 11.68% | 1,781 |
| Lamar | 2,887 | 57.08% | 2,163 | 42.76% | 8 | 0.16% | 724 | 14.31% | 5,058 |
| Lamb | 1,266 | 74.21% | 440 | 25.79% | 0 | 0.00% | 826 | 48.42% | 1,706 |
| Lampasas | 899 | 60.91% | 567 | 38.41% | 10 | 0.68% | 332 | 22.49% | 1,476 |
| La Salle | 327 | 40.57% | 479 | 59.43% | 0 | 0.00% | -152 | -18.86% | 806 |
| Lavaca | 911 | 24.27% | 2,842 | 75.73% | 0 | 0.00% | -1,931 | -51.45% | 3,753 |
| Lee | 449 | 27.63% | 1,176 | 72.37% | 0 | 0.00% | -727 | -44.74% | 1,625 |
| Leon | 543 | 38.59% | 862 | 61.27% | 2 | 0.14% | -319 | -22.67% | 1,407 |
| Liberty | 1,070 | 53.63% | 918 | 46.02% | 7 | 0.35% | 152 | 7.62% | 1,995 |
| Limestone | 1,642 | 38.64% | 2,608 | 61.36% | 0 | 0.00% | -966 | -22.73% | 4,250 |
| Lipscomb | 776 | 69.35% | 331 | 29.58% | 12 | 1.07% | 445 | 39.77% | 1,119 |
| Live Oak | 484 | 55.82% | 383 | 44.18% | 0 | 0.00% | 101 | 11.65% | 867 |
| Llano | 439 | 46.07% | 514 | 53.93% | 0 | 0.00% | -75 | -7.87% | 953 |
| Loving | 6 | 37.50% | 10 | 62.50% | 0 | 0.00% | -4 | -25.00% | 16 |
| Lubbock | 3,079 | 60.79% | 1,979 | 39.07% | 7 | 0.14% | 1,100 | 21.72% | 5,065 |
| Lynn | 1,268 | 62.49% | 754 | 37.16% | 7 | 0.34% | 514 | 25.33% | 2,029 |
| McCulloch | 1,294 | 63.59% | 741 | 36.41% | 0 | 0.00% | 553 | 27.17% | 2,035 |
| McLennan | 5,744 | 51.81% | 5,330 | 48.07% | 13 | 0.12% | 414 | 3.73% | 11,087 |
| McMullen | 96 | 50.00% | 94 | 48.96% | 2 | 1.04% | 2 | 1.04% | 192 |
| Madison | 364 | 44.61% | 452 | 55.39% | 0 | 0.00% | -88 | -10.78% | 816 |
| Marion | 443 | 40.90% | 640 | 59.10% | 0 | 0.00% | -197 | -18.19% | 1,083 |
| Martin | 330 | 60.77% | 213 | 39.23% | 0 | 0.00% | 117 | 21.55% | 543 |
| Mason | 807 | 76.64% | 244 | 23.17% | 2 | 0.19% | 563 | 53.47% | 1,053 |
| Matagorda | 1,194 | 58.85% | 829 | 40.86% | 6 | 0.30% | 365 | 17.99% | 2,029 |
| Maverick | 311 | 63.34% | 180 | 36.66% | 0 | 0.00% | 131 | 26.68% | 491 |
| Medina | 1,243 | 46.94% | 1,400 | 52.87% | 5 | 0.19% | -157 | -5.93% | 2,648 |
| Menard | 589 | 71.57% | 234 | 28.43% | 0 | 0.00% | 355 | 43.13% | 823 |
| Midland | 347 | 49.57% | 350 | 50.00% | 3 | 0.43% | -3 | -0.43% | 700 |
| Milam | 1,270 | 30.86% | 2,842 | 69.05% | 4 | 0.10% | -1,572 | -38.19% | 4,116 |
| Mills | 774 | 63.65% | 442 | 36.35% | 0 | 0.00% | 332 | 27.30% | 1,216 |
| Mitchell | 1,099 | 59.57% | 746 | 40.43% | 0 | 0.00% | 353 | 19.13% | 1,845 |
| Montague | 1,519 | 51.13% | 1,452 | 48.87% | 0 | 0.00% | 67 | 2.26% | 2,971 |
| Montgomery | 613 | 40.36% | 905 | 59.58% | 1 | 0.07% | -292 | -19.22% | 1,519 |
| Moore | 87 | 41.23% | 124 | 58.77% | 0 | 0.00% | -37 | -17.54% | 211 |
| Morris | 287 | 26.90% | 780 | 73.10% | 0 | 0.00% | -493 | -46.20% | 1,067 |
| Motley | 450 | 56.32% | 349 | 43.68% | 0 | 0.00% | 101 | 12.64% | 799 |
| Nacogdoches | 822 | 30.41% | 1,879 | 69.52% | 2 | 0.07% | -1,057 | -39.10% | 2,703 |
| Navarro | 3,341 | 47.80% | 3,648 | 52.20% | 0 | 0.00% | -307 | -4.39% | 6,989 |
| Newton | 397 | 41.27% | 564 | 58.63% | 1 | 0.10% | -167 | -17.36% | 962 |
| Nolan | 1,475 | 58.76% | 1,035 | 41.24% | 0 | 0.00% | 440 | 17.53% | 2,510 |
| Nueces | 2,481 | 45.36% | 2,985 | 54.58% | 3 | 0.05% | -504 | -9.22% | 5,469 |
| Ochiltree | 556 | 67.31% | 270 | 32.69% | 0 | 0.00% | 286 | 34.62% | 826 |
| Oldham | 172 | 52.28% | 157 | 47.72% | 0 | 0.00% | 15 | 4.56% | 329 |
| Orange | 919 | 42.43% | 1,247 | 57.57% | 0 | 0.00% | -328 | -15.14% | 2,166 |
| Palo Pinto | 2,001 | 63.28% | 1,161 | 36.72% | 0 | 0.00% | 840 | 26.57% | 3,162 |
| Panola | 420 | 24.21% | 1,312 | 75.62% | 3 | 0.17% | -892 | -51.41% | 1,735 |
| Parker | 2,178 | 66.24% | 1,110 | 33.76% | 0 | 0.00% | 1,068 | 32.48% | 3,288 |
| Parmer | 620 | 65.75% | 315 | 33.40% | 8 | 0.85% | 305 | 32.34% | 943 |
| Pecos | 524 | 47.99% | 562 | 51.47% | 6 | 0.55% | -38 | -3.48% | 1,092 |
| Polk | 508 | 33.73% | 994 | 66.00% | 4 | 0.27% | -486 | -32.27% | 1,506 |
| Potter | 3,627 | 57.90% | 2,637 | 42.10% | 0 | 0.00% | 990 | 15.80% | 6,264 |
| Presidio | 254 | 44.64% | 315 | 55.36% | 0 | 0.00% | -61 | -10.72% | 569 |
| Rains | 202 | 26.90% | 544 | 72.44% | 5 | 0.67% | -342 | -45.54% | 751 |
| Randall | 733 | 52.66% | 659 | 47.34% | 0 | 0.00% | 74 | 5.32% | 1,392 |
| Reagan | 387 | 62.82% | 229 | 37.18% | 0 | 0.00% | 158 | 25.65% | 616 |
| Real | 479 | 83.02% | 98 | 16.98% | 0 | 0.00% | 381 | 66.03% | 577 |
| Red River | 1,172 | 41.30% | 1,666 | 58.70% | 0 | 0.00% | -494 | -17.41% | 2,838 |
| Reeves | 344 | 46.61% | 394 | 53.39% | 0 | 0.00% | -50 | -6.78% | 738 |
| Refugio | 383 | 36.34% | 671 | 63.66% | 0 | 0.00% | -288 | -27.32% | 1,054 |
| Roberts | 243 | 70.03% | 104 | 29.97% | 0 | 0.00% | 139 | 40.06% | 347 |
| Robertson | 751 | 33.54% | 1,487 | 66.41% | 1 | 0.04% | -736 | -32.87% | 2,239 |
| Rockwall | 289 | 25.37% | 850 | 74.63% | 0 | 0.00% | -561 | -49.25% | 1,139 |
| Runnels | 1,645 | 52.26% | 1,494 | 47.46% | 9 | 0.29% | 151 | 4.80% | 3,148 |
| Rusk | 1,033 | 37.36% | 1,732 | 62.64% | 0 | 0.00% | -699 | -25.28% | 2,765 |
| Sabine | 419 | 34.18% | 807 | 65.82% | 0 | 0.00% | -388 | -31.65% | 1,226 |
| San Augustine | 467 | 36.26% | 821 | 63.74% | 0 | 0.00% | -354 | -27.48% | 1,288 |
| San Jacinto | 296 | 37.00% | 503 | 62.88% | 1 | 0.13% | -207 | -25.88% | 800 |
| San Patricio | 1,388 | 70.56% | 579 | 29.44% | 0 | 0.00% | 809 | 41.13% | 1,967 |
| San Saba | 682 | 47.56% | 752 | 52.44% | 0 | 0.00% | -70 | -4.88% | 1,434 |
| Schleicher | 227 | 62.36% | 137 | 37.64% | 0 | 0.00% | 90 | 24.73% | 364 |
| Scurry | 1,597 | 77.49% | 462 | 22.42% | 2 | 0.10% | 1,135 | 55.07% | 2,061 |
| Shackelford | 558 | 51.10% | 533 | 48.81% | 1 | 0.09% | 25 | 2.29% | 1,092 |
| Shelby | 676 | 25.53% | 1,961 | 74.06% | 11 | 0.42% | -1,285 | -48.53% | 2,648 |
| Sherman | 248 | 64.42% | 137 | 35.58% | 0 | 0.00% | 111 | 28.83% | 385 |
| Smith | 3,493 | 59.85% | 2,343 | 40.15% | 0 | 0.00% | 1,150 | 19.71% | 5,836 |
| Somervell | 241 | 63.93% | 136 | 36.07% | 0 | 0.00% | 105 | 27.85% | 377 |
| Starr | 79 | 9.69% | 736 | 90.31% | 0 | 0.00% | -657 | -80.61% | 815 |
| Stephens | 1,789 | 60.60% | 1,163 | 39.40% | 0 | 0.00% | 626 | 21.21% | 2,952 |
| Sterling | 122 | 42.21% | 167 | 57.79% | 0 | 0.00% | -45 | -15.57% | 289 |
| Stonewall | 442 | 46.92% | 500 | 53.08% | 0 | 0.00% | -58 | -6.16% | 942 |
| Sutton | 290 | 75.92% | 92 | 24.08% | 0 | 0.00% | 198 | 51.83% | 382 |
| Swisher | 887 | 70.34% | 374 | 29.66% | 0 | 0.00% | 513 | 40.68% | 1,261 |
| Tarrant | 20,481 | 68.99% | 9,208 | 31.01% | 0 | 0.00% | 11,273 | 37.97% | 29,689 |
| Taylor | 4,050 | 68.07% | 1,891 | 31.78% | 9 | 0.15% | 2,159 | 36.29% | 5,950 |
| Terrell | 364 | 80.71% | 85 | 18.85% | 2 | 0.44% | 279 | 61.86% | 451 |
| Terry | 622 | 60.45% | 407 | 39.55% | 0 | 0.00% | 215 | 20.89% | 1,029 |
| Throckmorton | 703 | 69.81% | 304 | 30.19% | 0 | 0.00% | 399 | 39.62% | 1,007 |
| Titus | 469 | 28.99% | 1,149 | 71.01% | 0 | 0.00% | -680 | -42.03% | 1,618 |
| Tom Green | 2,618 | 63.11% | 1,528 | 36.84% | 2 | 0.05% | 1,090 | 26.28% | 4,148 |
| Travis | 4,847 | 51.83% | 4,487 | 47.98% | 17 | 0.18% | 360 | 3.85% | 9,351 |
| Trinity | 456 | 39.93% | 686 | 60.07% | 0 | 0.00% | -230 | -20.14% | 1,142 |
| Tyler | 298 | 30.88% | 666 | 69.02% | 1 | 0.10% | -368 | -38.13% | 965 |
| Upshur | 649 | 29.37% | 1,553 | 70.27% | 8 | 0.36% | -904 | -40.90% | 2,210 |
| Upton | 270 | 58.82% | 189 | 41.18% | 0 | 0.00% | 81 | 17.65% | 459 |
| Uvalde | 1,224 | 62.10% | 747 | 37.90% | 0 | 0.00% | 477 | 24.20% | 1,971 |
| Val Verde | 854 | 57.94% | 620 | 42.06% | 0 | 0.00% | 234 | 15.88% | 1,474 |
| Van Zandt | 1,502 | 45.35% | 1,789 | 54.02% | 21 | 0.63% | -287 | -8.67% | 3,312 |
| Victoria | 663 | 27.94% | 1,710 | 72.06% | 0 | 0.00% | -1,047 | -44.12% | 2,373 |
| Walker | 488 | 39.51% | 747 | 60.49% | 0 | 0.00% | -259 | -20.97% | 1,235 |
| Waller | 376 | 42.68% | 504 | 57.21% | 1 | 0.11% | -128 | -14.53% | 881 |
| Ward | 216 | 45.76% | 256 | 54.24% | 0 | 0.00% | -40 | -8.47% | 472 |
| Washington | 275 | 9.94% | 2,491 | 90.06% | 0 | 0.00% | -2,216 | -80.12% | 2,766 |
| Webb | 767 | 32.16% | 1,615 | 67.71% | 3 | 0.13% | -848 | -35.56% | 2,385 |
| Wharton | 1,151 | 42.69% | 1,545 | 57.31% | 0 | 0.00% | -394 | -14.61% | 2,696 |
| Wheeler | 1,038 | 57.86% | 750 | 41.81% | 6 | 0.33% | 288 | 16.05% | 1,794 |
| Wichita | 7,226 | 59.82% | 4,853 | 40.18% | 0 | 0.00% | 2,373 | 19.65% | 12,079 |
| Wilbarger | 1,590 | 52.30% | 1,447 | 47.60% | 3 | 0.10% | 143 | 4.70% | 3,040 |
| Willacy | 389 | 49.55% | 396 | 50.45% | 0 | 0.00% | -7 | -0.89% | 785 |
| Williamson | 1,833 | 33.14% | 3,689 | 66.70% | 9 | 0.16% | -1,856 | -33.56% | 5,531 |
| Wilson | 622 | 29.33% | 1,499 | 70.67% | 0 | 0.00% | -877 | -41.35% | 2,121 |
| Winkler | 162 | 34.32% | 310 | 65.68% | 0 | 0.00% | -148 | -31.36% | 472 |
| Wise | 2,141 | 66.20% | 1,093 | 33.80% | 0 | 0.00% | 1,048 | 32.41% | 3,234 |
| Wood | 1,161 | 41.38% | 1,645 | 58.62% | 0 | 0.00% | -484 | -17.25% | 2,806 |
| Yoakum | 86 | 56.58% | 66 | 43.42% | 0 | 0.00% | 20 | 13.16% | 152 |
| Young | 1,826 | 58.88% | 1,275 | 41.12% | 0 | 0.00% | 551 | 17.77% | 3,101 |
| Zapata | 19 | 6.03% | 296 | 93.97% | 0 | 0.00% | -277 | -87.94% | 315 |
| Zavala | 571 | 71.38% | 229 | 28.63% | 0 | 0.00% | 342 | 42.75% | 800 |
| Totals | 372,324 | 51.88% | 344,542 | 48.00% | 867 | 0.12% | 27,782 | 3.87% | 717,733 |
Analysis edit
However, with all other prominent Democrats sitting the election out,[19] the party nominated Al Smith, four-term Governor of New York as its nominee for 1928, with little opposition, despite disagreement among Texas Democrats like Governor Moody, plus "Pa" and "Ma" Ferguson.[20] Smith had been the favorite for the 1924 nomination, but had lost due to opposition to his Catholic faith and "wet" views on Prohibition: he wished to repeal or modify the Volstead Act.
Once Smith was nominated – despite his attempt to dispel fears by nominating "dry" Southern Democrat Joseph T. Robinson as his running mate[21] – extreme fear ensued in the South, which mostly had little to no experience of the Catholic immigrants from southern and eastern Europe who were Smith's local constituency. Southern fundamentalist Protestants believed that Smith would allow papal and priestly leadership in the United States, which Protestantism was a reaction against.[22] There was also much opposition to Smith's support for repealing Prohibition, most notably from minister J. Frank Norris, who became the center of the anti-Smith campaign, saying that
Texas is the battleground for this, the most titanic struggle in the political, moral and religious life of the nation.[23]
The Southern Baptist Convention similarly said that
We enter into a sacred covenant and solemn pledge that we will support for the office of President, or any other office, only such men as stand for our present order of prohibition.[24]
Smith's campaign managers responded to this criticism by saying that the "Hoovercrats" were "Republicans, Klansmen and Bolsheviks".[25]
See also edit
Notes edit
- ^ Ironically, 4 years after achieving this historic feat, Hoover would go on to lose Texas by the largest margin of any major candidate in presidential history, losing every county and not even garnering 100,000 votes.[8]
References edit
- ^ Granthan, Dewey W.; The Life and Death of the Solid South: A Political History, pp. 3–4 ISBN 0813148723
- ^ Bass, Jack; The Transformation of Southern Politics: Social Change and Political Consequence Since 1945, p. 25 ISBN 0820317284
- ^ Weeks, O. Douglas; 'The Texas Mexican and the Politics of South Texas'; The American Political Science Review, vol. 24, no. 3 (Aug., 1930), pp. 606–627
- ^ Davidson, Chandler; Race and Class in Texas Politics, p. 21 ISBN 0691025398
- ^ Davison; Race and Class in Texas Politics, p. 24
- ^ Grantham; The Life and Death of the Solid South, pp. 50–52
- ^ Dave Leip's U.S. Election Atlas; Presidential General Election Results Comparison – Texas
- ^ Leip, Dave. "Dave Leip's US Presidential Election Atlas- Texas Results 1932". uselectionatlas. Dave Leip. Retrieved March 27, 2019.
- ^ Richardson, Rupert N.; Anderson, Adrian; Wintz, Cary D. and Wallace Ernest; Texas: The Lone Star State, p. 314 ISBN 1315509806
- ^ Dave Leip's U.S. Election Atlas; 1924 Presidential Election Statistics
- ^ Phillips, Kevin P.; The Emerging Republican Majority, pp. 214, 317, 352 ISBN 1400852293
- ^ Phillips; The Emerging Republican Majority, p. 212
- ^ McKay, Seth Shepard; Texas politics, 1906-1944, p. 182
- ^ Key, V.O. junior; Southern Politics in State and Nation; p. 324 ISBN 087049435X
- ^ Sullivan, Robert David; ‘How the Red and Blue Map Evolved Over the Past Century’; America Magazine in The National Catholic Review; June 29, 2016
- ^ "1928 Presidential General Election Results - Texas". Dave Leip's Atlas of U.S. Presidential Elections. Retrieved August 2, 2013.
- ^ Burnham, Walter Dean; ‘A Political Scientist and Voting-Rights Litigation: The Case of the 1966 Texas Registration Statute’; p. 353
- ^ Scammon, Richard M. (compiler); America at the Polls: A Handbook of Presidential Election Statistics 1920-1964; pp. 431–435 ISBN 0405077114
- ^ Warren, Kenneth F.; Encyclopedia of U.S. campaigns, elections, and electoral behavior: A-M, Volume 1, p. 620 ISBN 1412954894
- ^ Campbell, Randolph B.; Gone to Texas: A History of the Lone Star State, p. 376 ISBN 0195138422
- ^ Nelson, Michael (1991); Historic documents on presidential elections, 1787-1988, p. 296
- ^ Whisenhunt, Donald W.; President Herbert Hoover, p. 69 ISBN 1600214762
- ^ Marty, Martin E.; Modern American Religion, Volume 2: The Noise of Conflict, 1919-1941, p. 244
- ^ Maxwell, Angie and Shields, Todd G. (editors); Unlocking V.O. Key Jr.: "Southern Politics" for the Twenty-First Century, pp. 17–18 ISBN 1557289611
- ^ Slayton, Robert A.; Empire Statesman: The Rise and Fall of Al Smith; p. 284 ISBN 0684863022