


Summary
The 1928 United States presidential election in New York took place on November 6, 1928. All contemporary 48 states were part of the 1928 United States presidential election. State voters chose 45 electors to the Electoral College, which selected the president and vice president.
| ||||||||||||||||||||||||||
| Turnout | 68.3%[1] | |||||||||||||||||||||||||
|---|---|---|---|---|---|---|---|---|---|---|---|---|---|---|---|---|---|---|---|---|---|---|---|---|---|---|
| ||||||||||||||||||||||||||
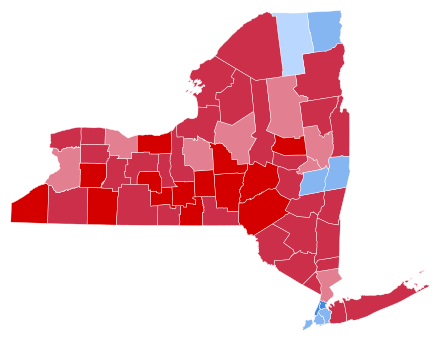 County Results
| ||||||||||||||||||||||||||
 Results in New York City by assembly district. The colors are the same as above with the following additions: Hoover 40–50% Hoover 50–60% Smith 40–50% Smith 50–60% Smith 60–70% Smith 70–80% Smith 80–90% | ||||||||||||||||||||||||||
| ||||||||||||||||||||||||||
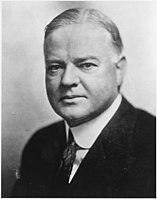
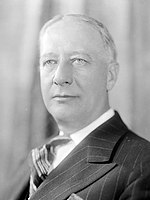
New York was won by Republican former Secretary of Commerce Herbert Hoover of California, who was running against Democratic Governor of New York Alfred E. Smith. Hoover's running mate was Senate Majority Leader Charles Curtis of Kansas, while Smith's running mate was Senator Joseph Taylor Robinson of Arkansas.
Hoover won with a plurality of 49.79 percent of the vote to Smith's 47.44 percent, a margin of 2.35 points. Socialist candidate Norman Thomas finished a distant third, with 2.44 percent. Although New York was Al Smith's home state and he had been elected governor there, the 1920s were a fiercely Republican decade in American politics, and New York during the Fourth Party System was a fiercely Republican state in presidential elections. In 1928, Herbert Hoover was winning the third consecutive nationwide Republican landslide, and the economic boom and social good feelings of the Roaring Twenties under popular Republican leadership proved too much for Smith to overcome both nationally and in his home state.
However, Smith's performance in New York was still impressive in the context of the 1920s, and highly significant in shaping the state's political development. In the elections preceding 1928, New York had been more Republican than the nation as a whole, even in the nationwide Republican landslides of 1920 and 1924. Smith's narrow 2-point defeat in the midst of the nationwide Republican landslide of 1928 made New York State 15% more Democratic than the national average. Smith's 47.44 percent was also the highest vote share a Democratic presidential candidate had received in New York State since former New York Governor Grover Cleveland won the state in 1892, as Woodrow Wilson only won the state with 41% in 1912 when the Republican vote was split.
Smith dramatically improved upon how Democrats before him had done and laid the groundwork for turning the state Democratic in 1932 and beyond. In 1920 and 1924, Republicans had swept every county in New York State and Democrats had received less than 30% of the vote. In 1928, Smith came within 2 points of winning the state by sweeping all five boroughs of heavily populated New York City, winning Albany County, home to the state capital of Albany, along with neighboring Rensselaer County, and winning two counties in northern New York along the Saint Lawrence River, Clinton County and Franklin County.
Results edit
| 1928 United States presidential election in New York[2] | |||||
|---|---|---|---|---|---|
| Party | Candidate | Votes | Percentage | Electoral votes | |
| Republican | Herbert Hoover | 2,193,344 | 49.79% | 45 | |
| Democratic | Alfred E. Smith | 2,089,863 | 47.44% | 0 | |
| Socialist | Norman Thomas | 107,332 | 2.44% | 0 | |
| Communist | William Z. Foster | 10,876 | 0.25% | 0 | |
| Socialist Labor | Verne L. Reynolds | 4,211 | 0.10% | 0 | |
| Totals | 4,405,626 | 100.0% | 45 | ||
New York City results edit
| 1928 Presidential Election in New York City | Manhattan | The Bronx | Brooklyn | Queens | Staten Island | Total | |||
| Democratic | Al Smith | 317,227 | 232,766 | 404,393 | 184,640 | 28,945 | 1,167,971 | 60.04% | |
| 60.82% | 67.67% | 59.48% | 53.43% | 53.37% | |||||
| Republican | Herbert Hoover | 186,396 | 98,636 | 245,622 | 158,505 | 24,995 | 714,154 | 36.71% | |
| 35.74% | 28.68% | 36.13% | 45.87% | 46.09% | |||||
| Socialist | Norman Thomas | 15,076 | 8,904 | 24,888 | 1,886 | 252 | 51,006 | 2.62% | |
| 2.89% | 2.59% | 3.66% | 0.55% | 0.46% | |||||
| Communist | William Z. Foster | 2,145 | 3,297 | 3,362 | 396 | 32 | 9,232 | 0.47% | |
| 0.41% | 0.96% | 0.49% | 0.11% | 0.06% | |||||
| Socialist Labor | Verne L. Reynolds | 714 | 344 | 1,572 | 129 | 10 | 2,769 | 0.14% | |
| 0.14% | 0.15% | 0.23% | 0.04% | 0.02% | |||||
| TOTAL | 521,558 | 343,947 | 679,837 | 345,556 | 54,234 | 1,945,132 | 100.00% | ||
Results by county edit
| County | Herbert Clark Hoover Republican |
Alfred Emmanuel Smith Democratic |
Normal Mattoon Thomas Socialist |
Various candidates Other parties |
Margin | Total votes cast[3] | |||||
|---|---|---|---|---|---|---|---|---|---|---|---|
| # | % | # | % | # | % | # | % | # | % | ||
| Albany | 48,762 | 42.99% | 62,380 | 54.99% | 2,223 | 1.96% | 72 | 0.06% | -13,618 | -12.00% | 113,437 |
| Allegany | 15,306 | 78.90% | 3,491 | 18.00% | 588 | 3.03% | 14 | 0.07% | 11,815 | 60.91% | 19,399 |
| Bronx | 98,636 | 28.68% | 232,766 | 67.67% | 8,904 | 2.59% | 3,641 | 1.06% | -134,130 | -39.00% | 343,947 |
| Broome | 39,860 | 65.25% | 19,563 | 32.02% | 1,552 | 2.54% | 117 | 0.19% | 20,297 | 33.22% | 61,092 |
| Cattaraugus | 22,135 | 67.07% | 10,229 | 31.00% | 602 | 1.82% | 35 | 0.11% | 11,906 | 36.08% | 33,001 |
| Cayuga | 20,202 | 62.11% | 11,787 | 36.24% | 512 | 1.57% | 24 | 0.07% | 8,415 | 25.87% | 32,525 |
| Chautauqua | 38,220 | 72.68% | 13,223 | 25.15% | 1,002 | 1.91% | 139 | 0.26% | 24,997 | 47.54% | 52,584 |
| Chemung | 25,029 | 67.00% | 12,189 | 32.63% | 109 | 0.29% | 27 | 0.07% | 12,840 | 34.37% | 37,354 |
| Chenango | 13,955 | 77.21% | 3,986 | 22.05% | 122 | 0.68% | 10 | 0.06% | 9,969 | 55.16% | 18,073 |
| Clinton | 7,824 | 41.68% | 10,888 | 58.00% | 57 | 0.30% | 2 | 0.01% | -3,064 | -16.32% | 18,771 |
| Columbia | 14,000 | 67.92% | 6,403 | 31.06% | 186 | 0.90% | 23 | 0.11% | 7,597 | 36.86% | 20,612 |
| Cortland | 11,960 | 75.37% | 3,662 | 23.08% | 234 | 1.47% | 13 | 0.08% | 8,298 | 52.29% | 15,869 |
| Delaware | 16,225 | 78.59% | 4,362 | 21.13% | 46 | 0.22% | 12 | 0.06% | 11,863 | 57.46% | 20,645 |
| Dutchess | 28,687 | 61.30% | 16,748 | 35.79% | 1,300 | 2.78% | 66 | 0.14% | 11,939 | 25.51% | 46,801 |
| Erie | 144,726 | 51.36% | 126,449 | 44.87% | 10,118 | 3.59% | 496 | 0.18% | 18,277 | 6.49% | 281,789 |
| Essex | 10,462 | 66.34% | 5,291 | 33.55% | 17 | 0.11% | 0 | 0.00% | 5,171 | 32.79% | 15,770 |
| Franklin | 9,495 | 49.86% | 9,501 | 49.89% | 47 | 0.25% | 2 | 0.01% | -6 | -0.03% | 19,045 |
| Fulton | 15,043 | 71.16% | 5,728 | 27.10% | 334 | 1.58% | 34 | 0.16% | 9,315 | 44.07% | 21,139 |
| Genesee | 13,251 | 69.03% | 5,181 | 26.99% | 739 | 3.85% | 24 | 0.13% | 8,070 | 42.04% | 19,195 |
| Greene | 9,529 | 66.71% | 4,440 | 31.08% | 308 | 2.16% | 8 | 0.06% | 5,089 | 35.62% | 14,285 |
| Hamilton | 1,399 | 59.51% | 952 | 40.49% | 0 | 0.00% | 0 | 0.00% | 447 | 19.01% | 2,351 |
| Herkimer | 18,624 | 62.69% | 10,654 | 35.86% | 412 | 1.39% | 19 | 0.06% | 7,970 | 26.83% | 29,709 |
| Jefferson | 26,361 | 66.41% | 12,908 | 32.52% | 402 | 1.01% | 24 | 0.06% | 13,453 | 33.89% | 39,695 |
| Kings | 245,622 | 36.13% | 404,393 | 59.48% | 24,888 | 3.66% | 4,934 | 0.73% | -158,771 | -23.35% | 679,837 |
| Lewis | 7,175 | 63.25% | 4,161 | 36.68% | 4 | 0.04% | 4 | 0.04% | 3,014 | 26.57% | 11,344 |
| Livingston | 11,632 | 64.05% | 5,545 | 30.53% | 968 | 5.33% | 15 | 0.08% | 6,087 | 33.52% | 18,160 |
| Madison | 14,333 | 72.20% | 5,217 | 26.28% | 280 | 1.41% | 21 | 0.11% | 9,116 | 45.92% | 19,851 |
| Monroe | 99,803 | 55.73% | 73,759 | 41.19% | 5,180 | 2.89% | 336 | 0.19% | 26,044 | 14.54% | 179,078 |
| Montgomery | 15,257 | 60.28% | 9,845 | 38.90% | 178 | 0.70% | 29 | 0.11% | 5,412 | 21.38% | 25,309 |
| Nassau | 71,015 | 62.77% | 40,079 | 35.42% | 1,901 | 1.68% | 145 | 0.13% | 30,936 | 27.34% | 113,140 |
| New York | 186,396 | 35.74% | 317,227 | 60.82% | 15,076 | 2.89% | 2,859 | 0.55% | -130,831 | -25.08% | 521,558 |
| Niagara | 33,229 | 63.35% | 16,881 | 32.18% | 2,302 | 4.39% | 41 | 0.08% | 16,348 | 31.17% | 52,453 |
| Oneida | 44,782 | 52.82% | 38,231 | 45.09% | 1,684 | 1.99% | 89 | 0.10% | 6,551 | 7.73% | 84,786 |
| Onondaga | 76,278 | 57.04% | 54,706 | 40.91% | 2,559 | 1.91% | 173 | 0.13% | 21,572 | 16.13% | 133,716 |
| Ontario | 17,769 | 65.27% | 8,491 | 31.19% | 955 | 3.51% | 10 | 0.04% | 9,278 | 34.08% | 27,225 |
| Orange | 37,334 | 64.10% | 19,047 | 32.70% | 1,817 | 3.12% | 42 | 0.07% | 18,287 | 31.40% | 58,240 |
| Orleans | 9,828 | 68.77% | 3,792 | 26.53% | 652 | 4.56% | 20 | 0.14% | 6,036 | 42.23% | 14,292 |
| Oswego | 21,849 | 64.39% | 11,639 | 34.30% | 418 | 1.23% | 24 | 0.07% | 10,210 | 30.09% | 33,930 |
| Otsego | 18,286 | 74.32% | 6,006 | 24.41% | 298 | 1.21% | 16 | 0.07% | 12,280 | 49.91% | 24,606 |
| Putnam | 4,534 | 64.95% | 2,278 | 32.63% | 161 | 2.31% | 8 | 0.11% | 2,256 | 32.32% | 6,981 |
| Queens | 158,505 | 45.87% | 184,640 | 53.43% | 1,886 | 0.55% | 525 | 0.15% | -26,135 | -7.56% | 345,556 |
| Rensselaer | 32,370 | 48.90% | 33,094 | 50.00% | 638 | 0.96% | 89 | 0.13% | -724 | -1.09% | 66,191 |
| Richmond | 24,995 | 46.09% | 28,945 | 53.37% | 252 | 0.46% | 42 | 0.08% | -3,950 | -7.28% | 54,234 |
| Rockland | 15,732 | 60.34% | 9,769 | 37.47% | 513 | 1.97% | 58 | 0.22% | 5,963 | 22.87% | 26,072 |
| Saratoga | 19,183 | 59.60% | 12,247 | 38.05% | 722 | 2.24% | 35 | 0.11% | 6,936 | 21.55% | 32,187 |
| Schenectady | 29,428 | 56.58% | 21,277 | 40.91% | 1,183 | 2.27% | 121 | 0.23% | 8,151 | 15.67% | 52,009 |
| Schoharie | 6,906 | 67.65% | 2,926 | 28.66% | 357 | 3.50% | 20 | 0.20% | 3,980 | 38.99% | 10,209 |
| Schuyler | 4,749 | 72.10% | 1,731 | 26.28% | 103 | 1.56% | 4 | 0.06% | 3,018 | 45.82% | 6,587 |
| Seneca | 7,911 | 66.27% | 3,873 | 32.44% | 147 | 1.23% | 7 | 0.06% | 4,038 | 33.82% | 11,938 |
| St. Lawrence | 25,804 | 66.23% | 12,567 | 32.26% | 562 | 1.44% | 27 | 0.07% | 13,237 | 33.98% | 38,960 |
| Steuben | 28,028 | 69.26% | 10,699 | 26.44% | 1,694 | 4.19% | 45 | 0.11% | 17,329 | 42.82% | 40,466 |
| Suffolk | 41,199 | 65.07% | 19,497 | 30.79% | 2,544 | 4.02% | 75 | 0.12% | 21,702 | 34.28% | 63,315 |
| Sullivan | 10,331 | 61.27% | 6,207 | 36.81% | 284 | 1.68% | 39 | 0.23% | 4,124 | 24.46% | 16,861 |
| Tioga | 9,963 | 76.89% | 2,779 | 21.45% | 198 | 1.53% | 18 | 0.14% | 7,184 | 55.44% | 12,958 |
| Tompkins | 14,471 | 72.84% | 5,114 | 25.74% | 244 | 1.23% | 37 | 0.19% | 9,357 | 47.10% | 19,866 |
| Ulster | 25,418 | 62.46% | 14,200 | 34.89% | 1,024 | 2.52% | 53 | 0.13% | 11,218 | 27.57% | 40,695 |
| Warren | 11,697 | 63.16% | 6,793 | 36.68% | 29 | 0.16% | 0 | 0.00% | 4,904 | 26.48% | 18,519 |
| Washington | 15,499 | 66.91% | 7,221 | 31.17% | 428 | 1.85% | 15 | 0.06% | 8,278 | 35.74% | 23,163 |
| Wayne | 18,187 | 75.29% | 5,338 | 22.10% | 603 | 2.50% | 27 | 0.11% | 12,849 | 53.19% | 24,155 |
| Westchester | 109,939 | 56.22% | 80,926 | 41.39% | 4,408 | 2.25% | 271 | 0.14% | 29,013 | 14.84% | 195,544 |
| Wyoming | 10,830 | 71.48% | 3,992 | 26.35% | 326 | 2.15% | 4 | 0.03% | 6,838 | 45.13% | 15,152 |
| Yates | 7,386 | 78.62% | 1,950 | 20.76% | 52 | 0.55% | 7 | 0.07% | 5,436 | 57.86% | 9,395 |
| Totals | 2,193,344 | 49.79% | 2,089,863 | 47.44% | 107,332 | 2.44% | 15,087 | 0.34% | 103,481 | 2.35% | 4,405,626 |
Analysis edit
Key to Smith's strength in New York State was his sweep of the five massively populated boroughs of New York City. A New York City native, Smith took over 60% of the vote in Manhattan and the Bronx, and also won majorities in Brooklyn, Queens, and Staten Island. Up to this point, 1928 was the strongest victory ever for a Democrat in the city. Smith, a Roman Catholic of Irish, Italian, and German immigrant heritage, held special appeal to Catholic and ethnic immigrant communities that populated cities like New York and Boston. The first Catholic to be nominated on a major-party ticket, Smith's Catholicism would severely weaken his candidacy in many rural parts of the country, especially in the South,[4] but would prove an asset in appealing to voters in New York.[5] The urban, ethnic coalition that delivered New York City to Al Smith would prove to be a harbinger of long-term realignment of both the city and the state toward the Democratic Party.[5] 1928 began a Democratic winning streak in New York City that has never been broken since, as New York City would be solidified as one of the most Democratic cities in the United States,[6] and a major obstacle to overcome for any Republican seeking to compete in New York State. 1928 also turned the state capital of Albany, which had previously been a Republican city, into a Democratic bastion in upstate New York. This was the first time Democrats swept all five boroughs of New York City, which would also occur in 1932 and 1936.
Hoover, for his part, was able to hold on to New York State's electoral votes in 1928 by sweeping much of traditionally staunchly Republican upstate New York and Long Island, where efforts from Hoover's future successor Franklin D. Roosevelt could not swing dry, Protestant Yankee voters to Smith.[7] In addition, the turnout and vote number margins were not yet there in New York City in 1928 to overcome Republican dominance in the rest of the state. In 1932, Franklin D. Roosevelt would build on Smith's coalition to flip New York State into the Democratic column, winning the state with virtually the same county map as Smith, but with stronger vote number margins and turnout. After 1928, New York state would not vote Republican again until 1948.
See also edit
References edit
- ^ Bicentennial Edition: Historical Statistics of the United States, Colonial Times to 1970, part 2, p. 1072.
- ^ "1928 Presidential Election Results – New York". Dave Leip's U.S. Election Atlas. Retrieved July 27, 2013.
- ^ New York State Department of State, ‘Presidential Vote, New York State By Counties, November 6, 1928,’ Manual for the Use of the Legislature of the State of New York, 1929 (Albany, 1929)
- ^ Gould, Lewis L.; The Republicans: A History of the Grand Old Party, p. 180 ISBN 0199936625
- ^ a b Phillips, Kevin P.; The Emerging Republican Majority, pp. 14, 40-41 ISBN 9780691163246
- ^ Sullivan, Robert David; ‘How the Red and Blue Map Evolved Over the Past Century’; America Magazine in The National Catholic Review; June 29, 2016
- ^ McElvaine, Robert S. ; Encyclopedia of the Great Depression: A-K, pp. 229, 276 ISBN 9780028656878