


Summary
The 1920 United States presidential election in North Dakota took place on November 2, 1920, as part of the 1920 United States presidential election which was held throughout all contemporary 48 states. Voters chose five representatives, or electors to the Electoral College, who voted for president and vice president.
| ||||||||||||||||||||||||||
| ||||||||||||||||||||||||||
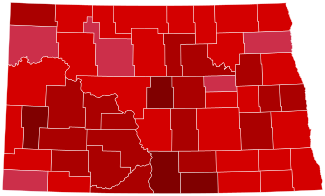 County Results
Harding 60-70% 70-80% 80-90% 90-100%
| ||||||||||||||||||||||||||
| ||||||||||||||||||||||||||
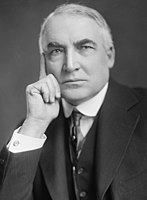

North Dakota voted for Republican nominee, Senator Warren G. Harding of Ohio, over the Democratic nominee, Governor James M. Cox of Ohio. Harding ran with Governor Calvin Coolidge of Massachusetts, while Cox ran with Assistant Secretary of the Navy Franklin D. Roosevelt of New York. Harding won the state by a landslide margin of 59.60 percentage points, the strongest performance of any presidential candidate in state history.
With 77.97 percent of the popular vote, North Dakota would prove to be Harding's strongest state in terms of popular vote percentage and margin of victory.[1]
Results edit
| 1920 United States presidential election in North Dakota[2] | ||||||||
|---|---|---|---|---|---|---|---|---|
| Party | Candidate | Running mate | Popular vote | Electoral vote | ||||
| Count | % | Count | % | |||||
| Republican | Warren Gamaliel Harding of Ohio | Calvin Coolidge of Massachusetts | 160,072 | 77.97% | 5 | 100.00% | ||
| Democratic | James Middleton Cox of Ohio | Franklin Delano Roosevelt of New York | 37,422 | 18.19% | 0 | 0.00% | ||
| Socialist | Eugene Victor Debs of Indiana | Seymour Stedman of Illinois | 8,282 | 4.02% | 0 | 0.00% | ||
| Total | 205,776 | 100.00% | 5 | 100.00% | ||||
Results by county edit
| County[3] | Warren Gamaliel Harding Republican |
James Middleton Cox Democratic |
Eugene Victor Debs Socialist |
Margin | Total votes cast | ||||
|---|---|---|---|---|---|---|---|---|---|
| # | % | # | % | # | % | # | % | ||
| Adams | 1,377 | 77.88% | 347 | 19.63% | 44 | 2.49% | 1,030 | 58.26% | 1,768 |
| Barnes | 5,150 | 80.27% | 1,101 | 17.16% | 165 | 2.57% | 4,049 | 63.11% | 6,416 |
| Benson | 3,540 | 81.10% | 680 | 15.58% | 145 | 3.32% | 2,860 | 65.52% | 4,365 |
| Billings | 787 | 91.51% | 61 | 7.09% | 12 | 1.40% | 726 | 84.42% | 860 |
| Bottineau | 3,487 | 72.52% | 970 | 20.17% | 351 | 7.30% | 2,517 | 52.35% | 4,808 |
| Bowman | 1,192 | 69.79% | 321 | 18.79% | 195 | 11.42% | 871 | 51.00% | 1,708 |
| Burke | 1,911 | 70.94% | 456 | 16.93% | 327 | 12.14% | 1,455 | 54.01% | 2,694 |
| Burleigh | 4,300 | 77.28% | 943 | 16.95% | 321 | 5.77% | 3,357 | 60.33% | 5,564 |
| Cass | 10,735 | 77.02% | 2,817 | 20.21% | 386 | 2.77% | 7,918 | 56.81% | 13,938 |
| Cavalier | 3,936 | 79.21% | 981 | 19.74% | 52 | 1.05% | 2,955 | 59.47% | 4,969 |
| Dickey | 2,887 | 75.79% | 766 | 20.11% | 156 | 4.10% | 2,121 | 55.68% | 3,809 |
| Divide | 2,438 | 80.81% | 462 | 15.31% | 117 | 3.88% | 1,976 | 65.50% | 3,017 |
| Dunn | 2,102 | 80.60% | 457 | 17.52% | 49 | 1.88% | 1,645 | 63.08% | 2,608 |
| Eddy | 1,525 | 68.76% | 577 | 26.01% | 116 | 5.23% | 948 | 42.74% | 2,218 |
| Emmons | 2,900 | 91.77% | 238 | 7.53% | 22 | 0.70% | 2,662 | 84.24% | 3,160 |
| Foster | 1,583 | 78.99% | 371 | 18.51% | 50 | 2.50% | 1,212 | 60.48% | 2,004 |
| Golden Valley | 1,177 | 77.08% | 286 | 18.73% | 64 | 4.19% | 891 | 58.35% | 1,527 |
| Grand Forks | 7,646 | 74.00% | 2,527 | 24.46% | 159 | 1.54% | 5,119 | 49.55% | 10,332 |
| Grant | 2,184 | 83.17% | 296 | 11.27% | 146 | 5.56% | 1,888 | 71.90% | 2,626 |
| Griggs | 1,739 | 73.84% | 530 | 22.51% | 86 | 3.65% | 1,209 | 51.34% | 2,355 |
| Hettinger | 1,849 | 83.44% | 327 | 14.76% | 40 | 1.81% | 1,522 | 68.68% | 2,216 |
| Kidder | 1,855 | 80.69% | 336 | 14.62% | 108 | 4.70% | 1,519 | 66.07% | 2,299 |
| LaMoure | 2,991 | 77.59% | 645 | 16.73% | 219 | 5.68% | 2,346 | 60.86% | 3,855 |
| Logan | 1,590 | 89.68% | 154 | 8.69% | 29 | 1.64% | 1,436 | 80.99% | 1,773 |
| McHenry | 3,534 | 74.09% | 848 | 17.78% | 388 | 8.13% | 2,686 | 56.31% | 4,770 |
| McIntosh | 1,782 | 94.34% | 79 | 4.18% | 28 | 1.48% | 1,703 | 90.15% | 1,889 |
| McKenzie | 2,587 | 79.50% | 511 | 15.70% | 156 | 4.79% | 2,076 | 63.80% | 3,254 |
| McLean | 3,724 | 74.23% | 748 | 14.91% | 545 | 10.86% | 2,976 | 59.32% | 5,017 |
| Mercer | 1,786 | 87.25% | 172 | 8.40% | 89 | 4.35% | 1,614 | 78.85% | 2,047 |
| Morton | 4,618 | 86.37% | 632 | 11.82% | 97 | 1.81% | 3,986 | 74.55% | 5,347 |
| Mountrail | 2,960 | 72.73% | 687 | 16.88% | 423 | 10.39% | 2,273 | 55.85% | 4,070 |
| Nelson | 3,127 | 84.49% | 501 | 13.54% | 73 | 1.97% | 2,626 | 70.95% | 3,701 |
| Oliver | 1,105 | 85.86% | 111 | 8.62% | 71 | 5.52% | 994 | 77.23% | 1,287 |
| Pembina | 3,925 | 73.24% | 1,405 | 26.22% | 29 | 0.54% | 2,520 | 47.02% | 5,359 |
| Pierce | 2,102 | 84.59% | 294 | 11.83% | 89 | 3.58% | 1,808 | 72.76% | 2,485 |
| Ramsey | 3,996 | 79.33% | 937 | 18.60% | 104 | 2.06% | 3,059 | 60.73% | 5,037 |
| Ransom | 3,010 | 77.30% | 802 | 20.60% | 82 | 2.11% | 2,208 | 56.70% | 3,894 |
| Renville | 1,987 | 73.65% | 581 | 21.53% | 130 | 4.82% | 1,406 | 52.11% | 2,698 |
| Richland | 5,483 | 79.46% | 1,339 | 19.41% | 78 | 1.13% | 4,144 | 60.06% | 6,900 |
| Rolette | 2,139 | 75.05% | 535 | 18.77% | 176 | 6.18% | 1,604 | 56.28% | 2,850 |
| Sargent | 2,787 | 78.18% | 673 | 18.88% | 105 | 2.95% | 2,114 | 59.30% | 3,565 |
| Sheridan | 1,776 | 92.12% | 134 | 6.95% | 18 | 0.93% | 1,642 | 85.17% | 1,928 |
| Sioux | 776 | 80.75% | 163 | 16.96% | 22 | 2.29% | 613 | 63.79% | 961 |
| Slope | 1,143 | 76.56% | 235 | 15.74% | 115 | 7.70% | 908 | 60.82% | 1,493 |
| Stark | 3,526 | 86.23% | 532 | 13.01% | 31 | 0.76% | 2,994 | 73.22% | 4,089 |
| Steele | 2,222 | 85.17% | 337 | 12.92% | 50 | 1.92% | 1,885 | 72.25% | 2,609 |
| Stutsman | 5,531 | 77.41% | 1,394 | 19.51% | 220 | 3.08% | 4,137 | 57.90% | 7,145 |
| Towner | 2,192 | 79.33% | 476 | 17.23% | 95 | 3.44% | 1,716 | 62.11% | 2,763 |
| Traill | 3,666 | 86.00% | 523 | 12.27% | 74 | 1.74% | 3,143 | 73.73% | 4,263 |
| Walsh | 4,581 | 67.13% | 2,047 | 30.00% | 196 | 2.87% | 2,534 | 37.13% | 6,824 |
| Ward | 6,166 | 67.41% | 2,291 | 25.05% | 690 | 7.54% | 3,875 | 42.36% | 9,147 |
| Wells | 3,202 | 85.71% | 456 | 12.21% | 78 | 2.09% | 2,746 | 73.50% | 3,736 |
| Williams | 3,768 | 65.31% | 1,330 | 23.05% | 671 | 11.63% | 2,438 | 42.26% | 5,769 |
| Totals | 160,072 | 77.79% | 37,422 | 18.19% | 8,282 | 4.02% | 122,650 | 59.60% | 205,776 |
See also edit
References edit
- ^ "1920 Presidential Election Statistics". Dave Leip’s Atlas of U.S. Presidential Elections. Retrieved March 5, 2018.
- ^ "1920 Presidential General Election Results – North Dakota". U.S. Election Atlas. Retrieved December 23, 2013.
- ^ North Dakota Secretary of State Elections; Party Votes, General Election, November 2, 1920