


Summary
The 1896 United States presidential election in Mississippi took place on November 3, 1896. All contemporary 45 states were part of the 1896 United States presidential election. Voters chose nine electors to the Electoral College, which selected the president and vice president.
| |||||||||||||||||||||||||||||
| |||||||||||||||||||||||||||||
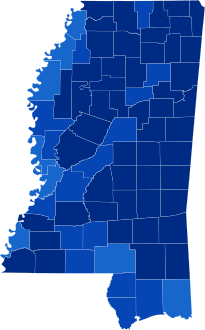 County Results
Bryan 70-80% 80-90% 90-100%
| |||||||||||||||||||||||||||||
| |||||||||||||||||||||||||||||


Mississippi was won by the Democratic nominees, former U.S. Representative William Jennings Bryan of Nebraska and his running mate Arthur Sewall of Maine. They defeated the Republican nominees, former Governor of Ohio William McKinley and Garret Hobart of New Jersey. Bryan won the state by a landslide margin of 84.12%.
With black disfranchisement virtually complete due to onerous poll taxes and literacy tests, Mississippi would begin seven decades as a one-party Democratic state, as the state completely lacked areas of upland or German refugee whites opposed to secession.[1] No Republican would serve in the state legislature between 1902 and the 1960s, and only once until 1950 – when Herbert Hoover won riding on anti-Catholic and Prohibitionist sentiment the Pine Belt counties of Pearl River, Stone[a] and George[b] in 1928 – would the state Democratic nominee[c] lose a Mississippi county in any Presidential election.[2]
With 91.04% of the popular vote, Mississippi would prove to be Bryan's strongest state in the 1896 presidential election.[3]
Bryan would later win Mississippi against McKinley four years later and would later win the state again in 1908 against William Howard Taft.
Results edit
| 1896 United States presidential election in Mississippi[4] | |||||
|---|---|---|---|---|---|
| Party | Candidate | Votes | Percentage | Electoral votes | |
| Democratic | William Jennings Bryan | 55,838 | 80.24% | 9 | |
| Populist | William Jennings Bryan | 7,517 | 10.80% | 0 | |
| Total | William Jennings Bryan | 63,355 | 91.04% | 9 | |
| Republican | William McKinley | 4,819 | 6.92% | 0 | |
| National Democratic | John M. Palmer | 1,021 | 1.47% | 0 | |
| Prohibition | Joshua Levering | 396 | 0.57% | 0 | |
| Totals | 69,591 | 100.00% | 9 | ||
| Voter turnout | — | ||||
Results by county edit
| County | William Jennings Bryan Democratic |
William McKinley Republican |
John McAuley Palmer[5] National Democratic |
Joshua Levering[5] Prohibition |
Margin | Total votes cast[6] | |||||
|---|---|---|---|---|---|---|---|---|---|---|---|
| # | % | # | % | # | % | # | % | # | % | ||
| Adams | 507 | 70.91% | 174 | 24.34% | 30 | 4.20% | 4 | 0.56% | 333 | 46.57% | 715 |
| Alcorn | 925 | 93.72% | 57 | 5.78% | 2 | 0.20% | 3 | 0.30% | 868 | 87.94% | 987 |
| Amite | 983 | 95.72% | 21 | 2.04% | 17 | 1.66% | 6 | 0.58% | 962 | 93.67% | 1,027 |
| Attala | 1,307 | 87.72% | 164 | 11.01% | 11 | 0.74% | 8 | 0.54% | 1,143 | 76.71% | 1,490 |
| Benton | 636 | 84.46% | 113 | 15.01% | 1 | 0.13% | 3 | 0.40% | 523 | 69.46% | 753 |
| Bolivar | 360 | 72.00% | 117 | 23.40% | 3 | 0.60% | 20 | 4.00% | 243 | 48.60% | 500 |
| Calhoun | 948 | 92.76% | 33 | 3.23% | 30 | 2.94% | 11 | 1.08% | 915 | 89.53% | 1,022 |
| Carroll | 1,187 | 92.81% | 79 | 6.18% | 11 | 0.86% | 2 | 0.16% | 1,108 | 86.63% | 1,279 |
| Chickasaw | 666 | 86.83% | 70 | 9.13% | 20 | 2.61% | 11 | 1.43% | 596 | 77.71% | 767 |
| Choctaw | 904 | 93.68% | 54 | 5.60% | 4 | 0.41% | 3 | 0.31% | 850 | 88.08% | 965 |
| Claiborne | 514 | 89.86% | 15 | 2.62% | 41 | 7.17% | 2 | 0.35% | 499[d] | 82.69% | 572 |
| Clarke | 947 | 98.65% | 7 | 0.73% | 4 | 0.42% | 2 | 0.21% | 940 | 97.92% | 960 |
| Clay | 676 | 93.50% | 34 | 4.70% | 8 | 1.11% | 5 | 0.69% | 642 | 88.80% | 723 |
| Coahoma | 347 | 78.33% | 83 | 18.74% | 10 | 2.26% | 3 | 0.68% | 264 | 59.59% | 443 |
| Copiah | 1,588 | 94.86% | 63 | 3.76% | 17 | 1.02% | 6 | 0.36% | 1,525 | 91.10% | 1,674 |
| Covington | 731 | 90.69% | 72 | 8.93% | 1 | 0.12% | 2 | 0.25% | 659 | 81.76% | 806 |
| DeSoto | 888 | 91.74% | 58 | 5.99% | 21 | 2.17% | 1 | 0.10% | 830 | 85.74% | 968 |
| Franklin | 592 | 95.79% | 17 | 2.75% | 7 | 1.13% | 2 | 0.32% | 575 | 93.04% | 618 |
| Greene | 266 | 98.52% | 0 | 0.00% | 4 | 1.48% | 0 | 0.00% | 266[d] | 97.04% | 270 |
| Grenada | 483 | 94.89% | 20 | 3.93% | 2 | 0.39% | 4 | 0.79% | 463 | 90.96% | 509 |
| Hancock | 348 | 85.50% | 48 | 11.79% | 11 | 2.70% | 0 | 0.00% | 300 | 73.71% | 407 |
| Harrison | 237 | 87.78% | 17 | 6.30% | 15 | 5.56% | 1 | 0.37% | 220 | 81.48% | 270 |
| Hinds | 1,643 | 88.57% | 144 | 7.76% | 28 | 1.51% | 40 | 2.16% | 1,499 | 80.81% | 1,855 |
| Holmes | 1,010 | 92.24% | 74 | 6.76% | 6 | 0.55% | 5 | 0.46% | 936 | 85.48% | 1,095 |
| Issaquena | 97 | 75.78% | 29 | 22.66% | 1 | 0.78% | 1 | 0.78% | 68 | 53.13% | 128 |
| Itawamba | 1,089 | 95.78% | 32 | 2.81% | 11 | 0.97% | 5 | 0.44% | 1,057 | 92.96% | 1,137 |
| Jackson | 723 | 72.96% | 181 | 18.26% | 72 | 7.27% | 15 | 1.51% | 542 | 54.69% | 991 |
| Jasper | 871 | 95.50% | 20 | 2.19% | 16 | 1.75% | 5 | 0.55% | 851 | 93.31% | 912 |
| Jefferson | 627 | 91.40% | 55 | 8.02% | 1 | 0.15% | 3 | 0.44% | 572 | 83.38% | 686 |
| Jones | 934 | 94.53% | 35 | 3.54% | 14 | 1.42% | 5 | 0.51% | 899 | 90.99% | 988 |
| Kemper | 922 | 90.75% | 72 | 7.09% | 19 | 1.87% | 3 | 0.30% | 850 | 83.66% | 1,016 |
| Lafayette | 1,314 | 90.81% | 129 | 8.91% | 3 | 0.21% | 1 | 0.07% | 1,185 | 81.89% | 1,447 |
| Lauderdale | 1,978 | 92.60% | 98 | 4.59% | 42 | 1.97% | 18 | 0.84% | 1,880 | 88.01% | 2,136 |
| Lawrence | 774 | 80.71% | 175 | 18.25% | 8 | 0.83% | 2 | 0.21% | 599 | 62.46% | 959 |
| Leake | 1,164 | 91.94% | 91 | 7.19% | 4 | 0.32% | 7 | 0.55% | 1,073 | 84.76% | 1,266 |
| Lee | 1,241 | 96.43% | 34 | 2.64% | 9 | 0.70% | 3 | 0.23% | 1,207 | 93.78% | 1,287 |
| Leflore | 316 | 99.68% | 0 | 0.00% | 1 | 0.32% | 0 | 0.00% | 315[d] | 99.36% | 317 |
| Lincoln | 954 | 84.65% | 134 | 11.89% | 22 | 1.95% | 17 | 1.51% | 820 | 72.76% | 1,127 |
| Lowndes | 820 | 97.27% | 13 | 1.54% | 7 | 0.83% | 3 | 0.36% | 807 | 95.73% | 843 |
| Madison | 763 | 89.76% | 66 | 7.76% | 20 | 2.35% | 1 | 0.12% | 697 | 82.00% | 850 |
| Marion | 839 | 76.07% | 228 | 20.67% | 29 | 2.63% | 7 | 0.63% | 611 | 55.39% | 1,103 |
| Marshall | 1,286 | 93.32% | 72 | 5.22% | 13 | 0.94% | 7 | 0.51% | 1,214 | 88.10% | 1,378 |
| Monroe | 1,608 | 95.49% | 71 | 4.22% | 4 | 0.24% | 1 | 0.06% | 1,537 | 91.27% | 1,684 |
| Montgomery | 1,050 | 96.95% | 23 | 2.12% | 3 | 0.28% | 7 | 0.65% | 1,027 | 94.83% | 1,083 |
| Neshoba | 1,055 | 99.15% | 7 | 0.66% | 0 | 0.00% | 2 | 0.19% | 1,048 | 98.50% | 1,064 |
| Newton | 1,201 | 98.44% | 9 | 0.74% | 6 | 0.49% | 4 | 0.33% | 1,192 | 97.70% | 1,220 |
| Noxubee | 715 | 96.10% | 12 | 1.61% | 5 | 0.67% | 12 | 1.61% | 703 | 94.49% | 744 |
| Oktibbeha | 816 | 96.11% | 27 | 3.18% | 2 | 0.24% | 4 | 0.47% | 789 | 92.93% | 849 |
| Panola | 1,235 | 91.01% | 78 | 5.75% | 21 | 1.55% | 23 | 1.69% | 1,157 | 85.26% | 1,357 |
| Pearl River | 266 | 85.81% | 34 | 10.97% | 9 | 2.90% | 1 | 0.32% | 232 | 74.84% | 310 |
| Perry | 419 | 91.48% | 30 | 6.55% | 2 | 0.44% | 7 | 1.53% | 389 | 84.93% | 458 |
| Pike | 1,380 | 89.73% | 120 | 7.80% | 28 | 1.82% | 10 | 0.65% | 1,260 | 81.92% | 1,538 |
| Pontotoc | 944 | 92.28% | 64 | 6.26% | 4 | 0.39% | 11 | 1.08% | 880 | 86.02% | 1,023 |
| Prentiss | 973 | 92.31% | 59 | 5.60% | 18 | 1.71% | 4 | 0.38% | 914 | 86.72% | 1,054 |
| Quitman | 171 | 81.04% | 40 | 18.96% | 0 | 0.00% | 0 | 0.00% | 131 | 62.09% | 211 |
| Rankin | 1,044 | 92.23% | 76 | 6.71% | 9 | 0.80% | 3 | 0.27% | 968 | 85.51% | 1,132 |
| Scott | 780 | 95.94% | 23 | 2.83% | 3 | 0.37% | 7 | 0.86% | 757 | 93.11% | 813 |
| Sharkey | 194 | 87.78% | 22 | 9.95% | 1 | 0.45% | 4 | 1.81% | 172 | 77.83% | 221 |
| Simpson | 677 | 91.49% | 53 | 7.16% | 4 | 0.54% | 6 | 0.81% | 624 | 84.32% | 740 |
| Smith | 1,077 | 99.26% | 1 | 0.09% | 2 | 0.18% | 5 | 0.46% | 1,072[e] | 98.80% | 1,085 |
| Sunflower | 459 | 93.48% | 24 | 4.89% | 6 | 1.22% | 2 | 0.41% | 435 | 88.59% | 491 |
| Tallahatchie | 779 | 97.01% | 23 | 2.86% | 0 | 0.00% | 1 | 0.12% | 756 | 94.15% | 803 |
| Tate | 1,125 | 90.65% | 76 | 6.12% | 40 | 3.22% | 0 | 0.00% | 1,049 | 84.53% | 1,241 |
| Tippah | 1,063 | 90.55% | 103 | 8.77% | 5 | 0.43% | 3 | 0.26% | 960 | 81.77% | 1,174 |
| Tishomingo | 851 | 92.40% | 67 | 7.27% | 2 | 0.22% | 1 | 0.11% | 784 | 85.12% | 921 |
| Tunica | 174 | 72.20% | 62 | 25.73% | 4 | 1.66% | 1 | 0.41% | 112 | 46.47% | 241 |
| Union | 1,262 | 91.25% | 114 | 8.24% | 7 | 0.51% | 0 | 0.00% | 1,148 | 83.01% | 1,383 |
| Warren | 867 | 72.19% | 183 | 15.24% | 143 | 11.91% | 8 | 0.67% | 684 | 56.95% | 1,201 |
| Washington | 611 | 80.61% | 98 | 12.93% | 44 | 5.80% | 5 | 0.66% | 513 | 67.68% | 758 |
| Wayne | 655 | 94.79% | 30 | 4.34% | 5 | 0.72% | 1 | 0.14% | 625 | 90.45% | 691 |
| Webster | 876 | 86.82% | 127 | 12.59% | 5 | 0.50% | 1 | 0.10% | 749 | 74.23% | 1,009 |
| Wilkinson | 561 | 93.50% | 36 | 6.00% | 2 | 0.33% | 1 | 0.17% | 525 | 87.50% | 600 |
| Winston | 793 | 94.63% | 32 | 3.82% | 11 | 1.31% | 2 | 0.24% | 761 | 90.81% | 838 |
| Yalobusha | 1,110 | 91.51% | 73 | 6.02% | 24 | 1.98% | 6 | 0.49% | 1,037 | 85.49% | 1,213 |
| Yazoo | 1,159 | 97.48% | 24 | 2.02% | 6 | 0.50% | 0 | 0.00% | 1,135 | 95.46% | 1,189 |
| Totals | 63,355 | 91.05% | 4,819 | 6.93% | 1,021 | 1.47% | 390 | 0.56% | 58,536 | 84.12% | 69,585 |
See also edit
Notes edit
- ^ At the time of the 1892 election, Stone County was the northern part of Harrison County.
- ^ At the time of the 1892 election, what has been since 1910 George County was the northern part of Jackson County and the southern part of Greene County.
- ^ James Strom Thurmond, who was listed as the “States’ Rights Democratic Party” nominee at a national level, was listed as the “Democratic” nominee in Mississippi in the 1948 election, when he won every county with at least 56 percent of the vote.
- ^ a b c In this county where Palmer ran second ahead of McKinley, margin given is Bryan vote minus Palmer vote and percentage margin Bryan percentage minus Palmer percentage
- ^ In this county where Levering ran second ahead of both McKinley and Palmer, margin given is Bryan vote minus Levering vote and percentage margin Bryan percentage minus Levering percentage.
References edit
- ^ Phillips, Kevin P.; The Emerging Republican Majority, pp. 208, 210 ISBN 9780691163246
- ^ Menendez; Albert J.; The Geography of Presidential Elections in the United States, 1868-2004, pp. 233-236 ISBN 0786422173
- ^ "1896 Presidential Election Statistics". Dave Leip’s Atlas of U.S. Presidential Elections. Retrieved March 5, 2018.
- ^ Dave Leip's U.S. Election Atlas; Presidential General Election Results – Mississippi
- ^ a b Géoelections; Popular Vote at the Presidential Election for 1896 (.xlsx file for €30 including full minor party figures)
- ^ Robinson, Edgar Eugene; The Presidential Vote 1896-1932, pp. 241-247 ISBN 9780804716963